Published: 2026-01-14T00:32:58.000Z
Chart NZD/USD Update: Leaning lower in consolidation
-
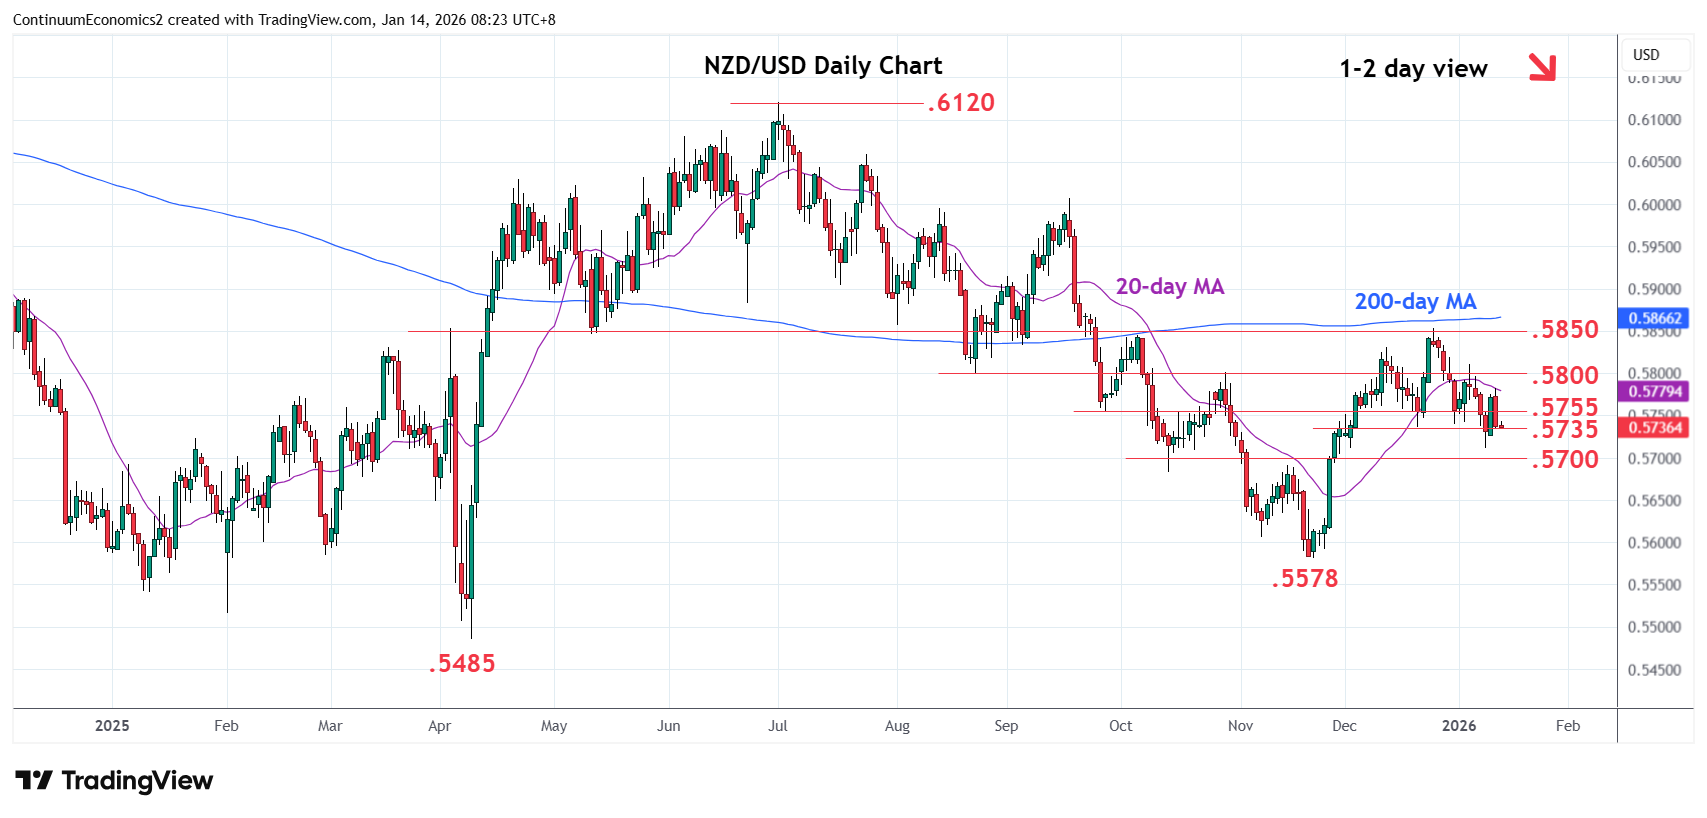
Leaning lower after bounce attempt met with selling pressure below the .5800 level to retest the 5735 support
| Levels | Imp | Comment | Levels | Imp | Comment | |||
|---|---|---|---|---|---|---|---|---|
| R4 | .5910 | * | 61.8% Jul/Nov fall | S1 | .5735 | * | 19 Dec low | |
| R3 | .5850 | ** | congestion, 50% | S2 | .5715/00 | ** | 50%, congestion | |
| R2 | .5830 | * | 11 Dec high | S3 | .5685 | * | 61.8% Nov/Dec rally | |
| R1 | .5800 | ** | Aug low, congestion | S4 | .5650 | congestion |
Asterisk denotes strength of level
00:25 GMT - Leaning lower after bounce attempt met with selling pressure below the .5800 level to retest the 5735 support. Negative intraday and daily studies keeps pressure on the downside and suggest room for break here to expose strong support at the .5715/00 area to retest. Below this will open up room for deeper pullback to retrace the November/December rally to .5685/.5650, 61.8% Fibonacci level and congestion area. Meanwhile resistance at the .5755/.5800 area is expected to cap. Break here will revive upside focus for retest of .5850 high and extend the broader gains from .5578 November low.