Published: 2025-11-04T14:29:15.000Z
Chart AUD/USD Update: Under pressure
1
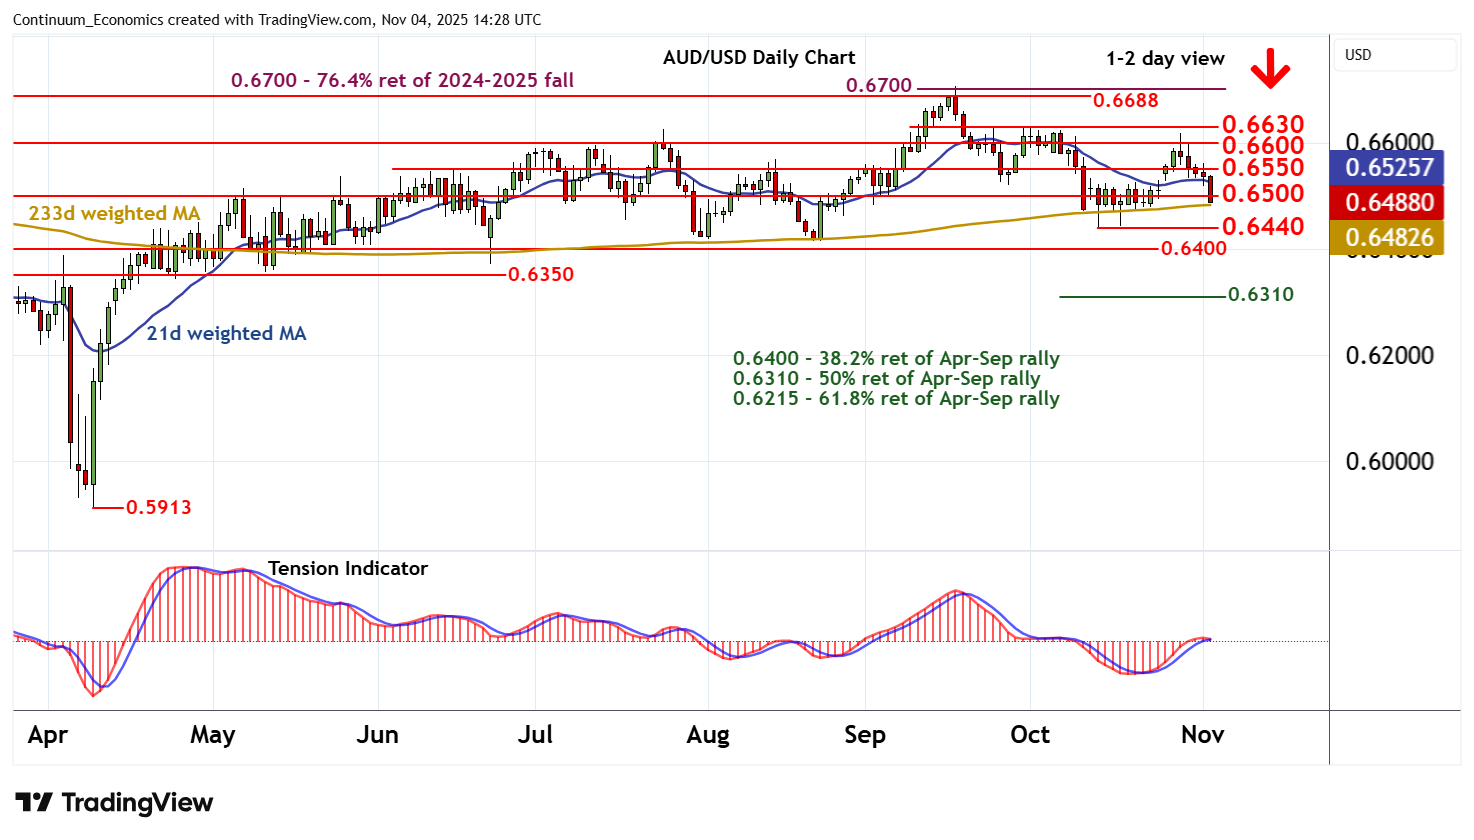
Anticipated losses have reached 0.6500
| Levels | Imp | Comment | Levels | Imp | Comment | |||
|---|---|---|---|---|---|---|---|---|
| R4 | 0.6688 | * | 7 Nov 2024 (m) high | S1 | 0.6500 | * | congestion | |
| R3 | 0.6630 | * | break level | S2 | 0.6440 | ** | 14 Oct (m) low | |
| R2 | 0.6600 | ** | congestion | S3 | 0.6400 | ** | congestion | |
| R1 | 0.6550 | * | congestion | S4 | 0.6350 | * | congestion lows |
Asterisk denotes strength of level
14:20 GMT - Anticipated losses have reached 0.6500, as intraday studies remain under pressure, with prices currently trading just lower around 0.6490. Daily stochastics are falling and broader weekly charts are also coming under pressure, highlighting room for deeper losses in the coming sessions. Focus is expected to turn to the 0.6440 monthly low of 14 October. A close beneath here will add weight to sentiment and extend mid-September losses initially to congestion around 0.6400. Meanwhile, resistance remains at congestion around 0.6550 and should cap any immediate tests higher.