Published: 2025-03-27T07:27:02.000Z
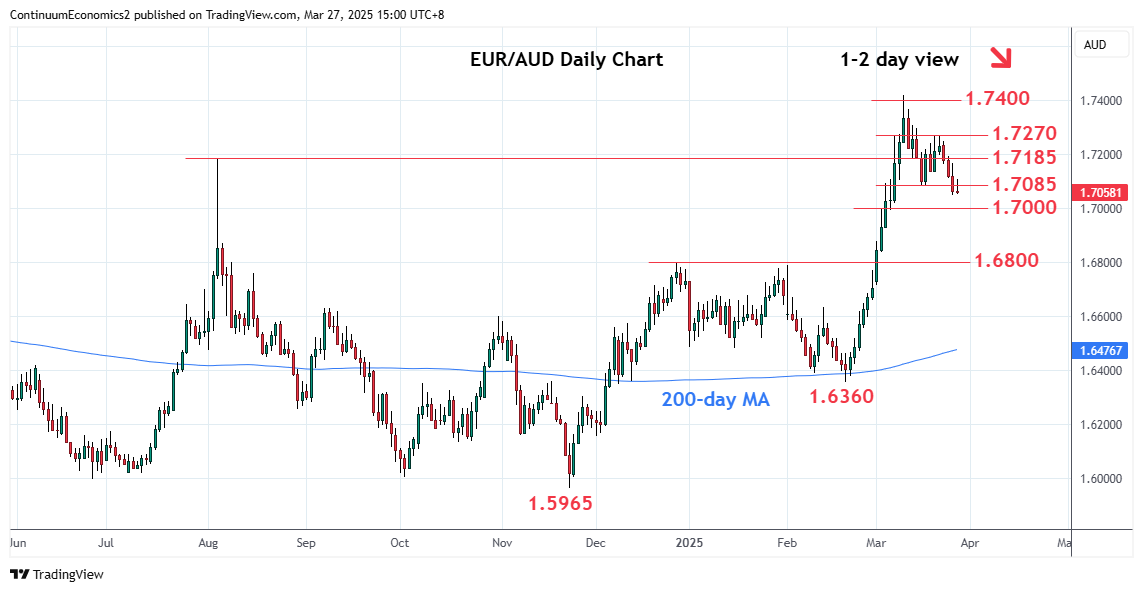
Chart EUR/AUD Update: Extending losses from 1.7418, March high

Technical Analyst
-
Break of the 1.7085 low of last week extending rejection from the 1.7418, March YTD high
| Levels | Imp | Comment | Levels | Imp | Comment | |||
|---|---|---|---|---|---|---|---|---|
| R4 | 1.7505 | * | 9 Apr 2020 high | S1 | 1.7050 | 26 Mar low | ||
| R3 | 1.7418 | ** | 11 Mar YTD high | S2 | 1.7000 | * | congestion | |
| R2 | 1.7270 | * | 7 Mar high | S3 | 1.6890 | * | 50% Feb/Mar rally | |
| R1 | 1.7185 | * | Aug 2024 year high | S4 | 1.6800 | ** | Dec high |
Asterisk denotes strength of level
07:20 GMT - Break of the 1.7085 low of last week extending rejection from the 1.7418, March YTD high. Daily studies are tracking lower and see room for deeper pullback to the 1.7000 congestion. Lower still, will see room to the 1.6890, 50% Fibonacci level. Below this will turn focus lower to the 1.6800/1.6790, December/February highs. Meanwhile, resistance is lowered to the 1.7185, August 2024 year high. This is expected to cap and sustain losses from the 1.7270 lower high.