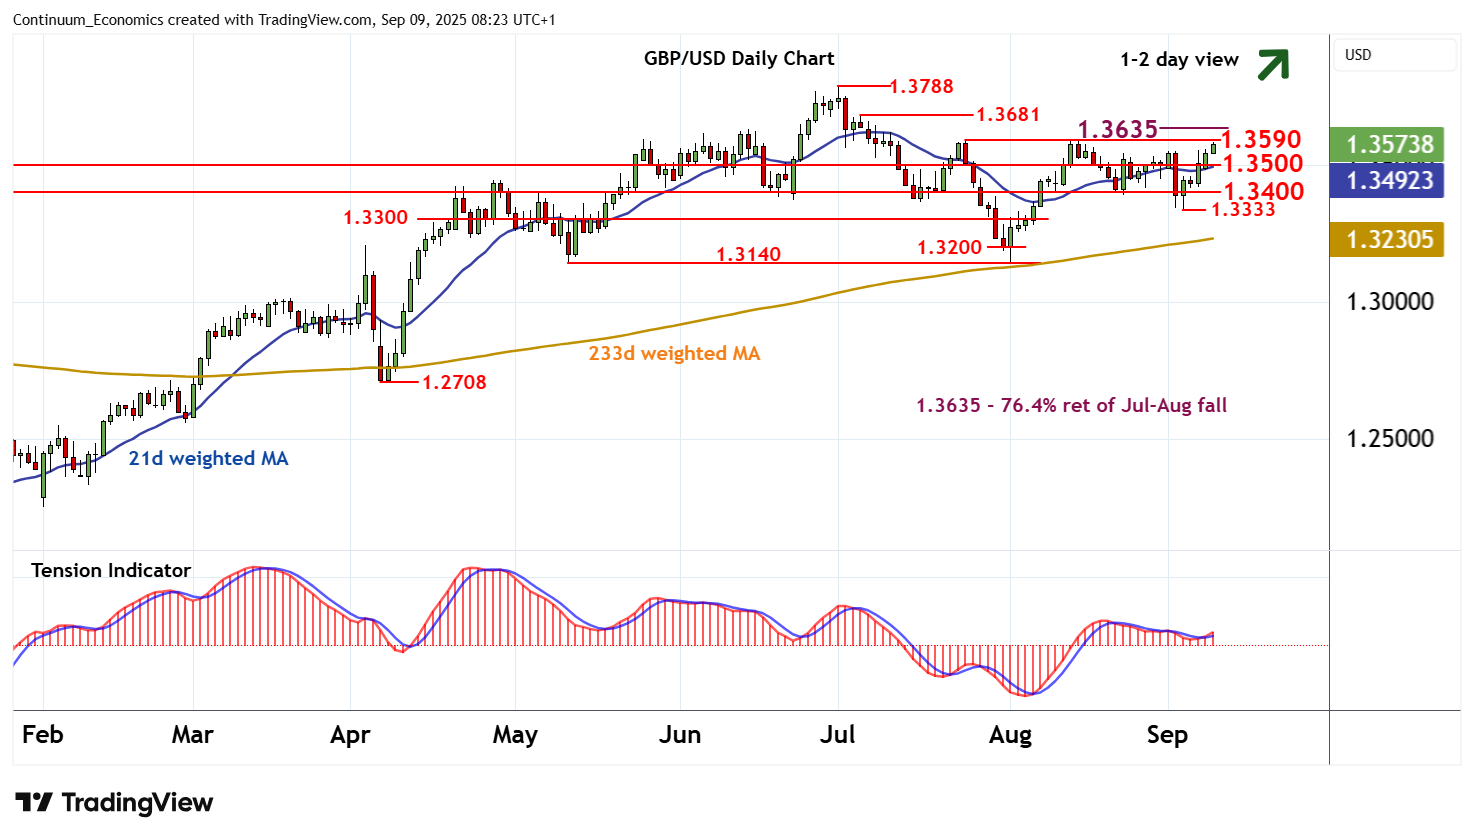
Chart GBP/USD Update: Strong resistance up to the 1.3635 Fibonacci retracement
The anticipated break above 1.3550 is meeting selling interest just beneath resistance at the 1.3590 weekly high of 24 July and congestion around 1.3600
| Level | Comment | Level | Comment | |||||
|---|---|---|---|---|---|---|---|---|
| R4 | 1.3788 | ** | 1 Jul YTD high | S1 | 1.3500 | ** | congestion | |
| R3 | 1.3681 | 4 Jul high | S2 | 1.3400 | * | congestion | ||
| R2 | 1.3635 | ** | 76.4% ret of Jul-Aug fall | S3 | 1.3333 | * | 3 Sep low | |
| R1 | 1.3590/00 | ** | 24 Jul (w) high; cong | S4 | 1.3300 | * | congestion |
Asterisk denotes strength of level
08:10 BST - The anticipated break above 1.3550 is meeting selling interest just beneath resistance at the 1.3590 weekly high of 24 July and congestion around 1.3600, as overbought intraday studies flatten, with prices currently balanced around 1.3565. However, daily readings continue rise and flat weekly stochastics are ticking higher, highlighting room for a later break. Focus will then turn to the 1.3635 Fibonacci retracement. But by-then overbought daily stochastics and the flat weekly Tension Indicator are expected to limit any tests in renewed selling interest. Meanwhile, support remains at congestion around 1.3500 and should underpin any immediate setbacks.