Published: 2025-10-09T00:59:56.000Z
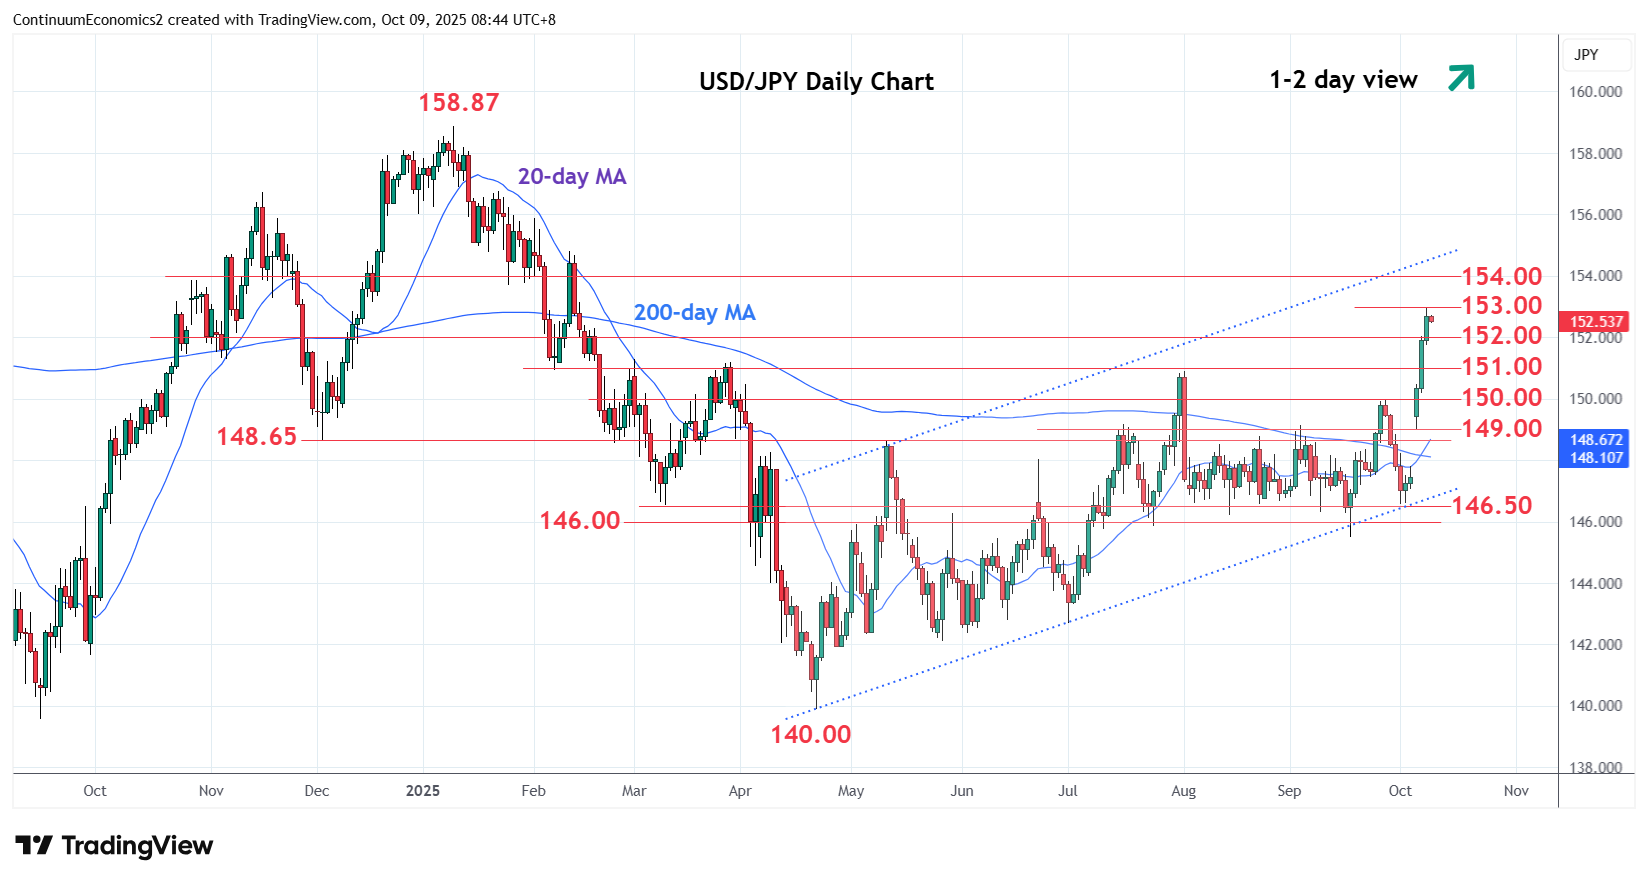
Chart USD/JPY Update: Consolidating test of 153.00
-
Break of the 152.00 resistance has seen gains extending to tag the 153.00 level before settling back

| Levels | Imp | Comment | Levels | Imp | Comment | |||
|---|---|---|---|---|---|---|---|---|
| R4 | 154.80 | * | 12 Feb high | S1 | 152.00 | * | congestion | |
| R3 | 154.40 | * | 76.4% Jan/Apr fall | S2 | 150.92 | ** | Aug high | |
| R2 | 154.00 | * | congestion | S3 | 150.00 | ** | Sep high | |
| R1 | 153.00/15 | * | congestion, 14 Feb high | S4 | 149.00 | * | 6 Oct low |
Asterisk denotes strength of level
00:50 GMT - Break of the 152.00 resistance has seen gains extending to tag the 153.00 level before settling back. Overbought intraday and daily studies suggest prices settling back in consolidation though a later break higher cannot be ruled out within the bullish channel from the April current year low. Higher, if seen, will open up room for extension to 154.00 level and 154.40, 76.4% Fibonacci level. Meanwhile, support is raised to the August high at 152.00 level which should underpin. Failure will open up room for pullback to the strong support at 150.92/150.00, August/September highs.