Published: 2026-03-18T17:19:30.000Z
Chart USD/CAD Update: Consolidating - studies improving
-
Little change
| Levels | Imp | Comment | Levels | Imp | Comment | |||
|---|---|---|---|---|---|---|---|---|
| R4 | 1.3800 | * | congestion | S1 | 1.3650 | congestion | ||
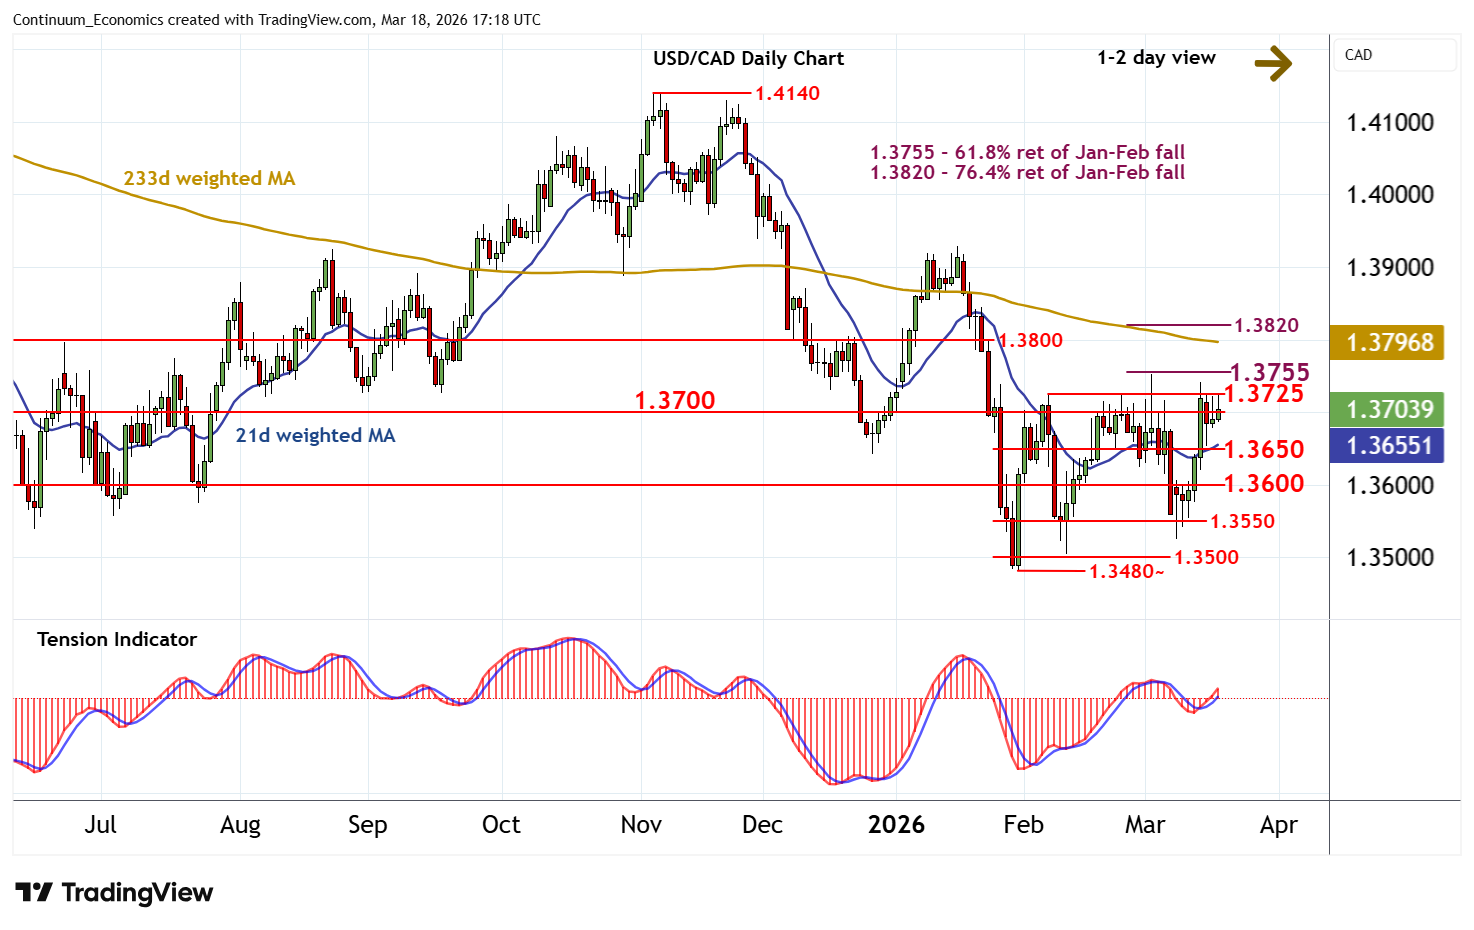
| R3 | 1.3755 | ** | 61.8% ret of Jan-Feb fall | S2 | 1.3600 | * | congestion | |
| R2 | 1.3725 | * | 6 Feb (m) high | S3 | 1.3550 | congestion | ||
| R1 | 1.3700 | * | congestion | S4 | 1.3500 | ** | congestion |
Asterisk denotes strength of level
17:05 GMT - Little change, as prices extend pressure on resistance at congestion at 1.3700 and the 1.3725 monthly high of 6 February. Daily readings continue to rise and broader weekly charts are improving, suggesting room for further strength in the coming sessions. But a close above the 1.3755 Fibonacci retracement is needed to turn sentiment positive and extend late-January gains towards 1.3800/20. Meanwhile, support at 1.3650 should underpin any immediate setbacks.