Published: 2026-03-03T08:47:58.000Z
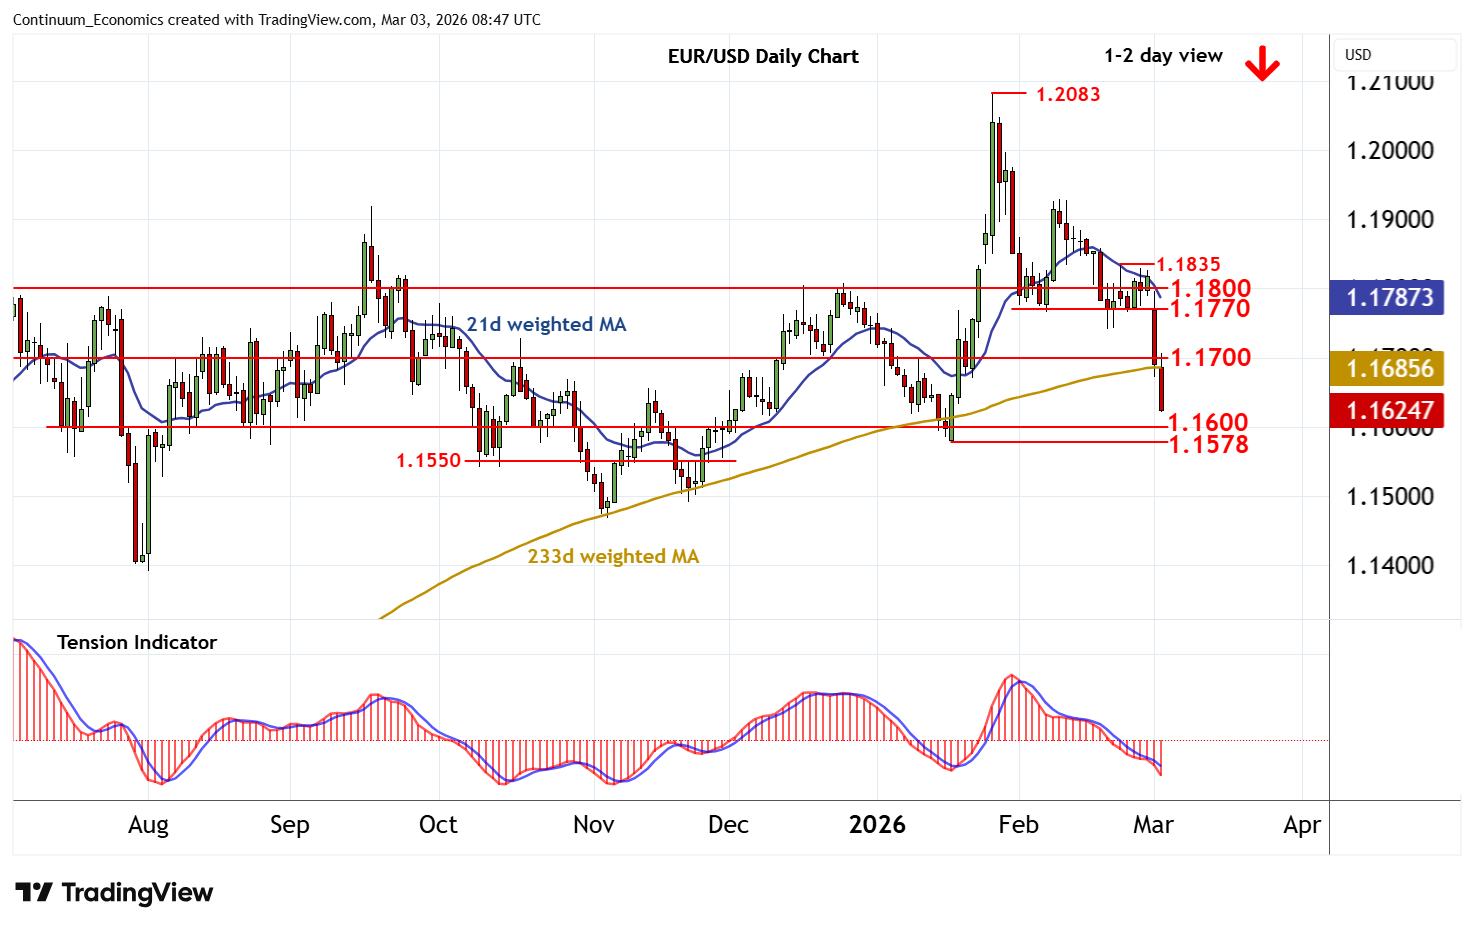
Chart EUR/USD Update: Extending losses
2
Cautious trade around congestion resistance at 1.1700 has given way to anticipated selling interest
| Levels | Imp | Comment | Levels | Imp | Comment | |||
|---|---|---|---|---|---|---|---|---|
| R4 | 1.1835 | * | 23 Feb (w) high | S1 | 1.1600 | ** | congestion | |
| R3 | 1.1800 | * | congestion | S2 | 1.1578 | * | 19 Jan YTD low | |
| R2 | 1.1770 | congestion lows | S3 | 1.1550 | * | congestion | ||
| R1 | 1.1700 | * | congestion | S4 | 1.1500 | ** | congestion |
*Asterisk denotes strength of level
08:40 GMT - Cautious trade around congestion resistance at 1.1700 has given way to anticipated selling interest, as intraday studies turn down, with prices currently trading around 1.1625. Daily readings are bearish and broader weekly charts are also under pressure, highlighting room for a test of congestion support at 1.1600. Just lower is the 1.1578 current year low of 19 January. A close beneath here will add weight to already bearish price action and extend late-January losses initially to 1.1550. Meanwhile, resistance remains at 1.1700 and should cap any immediate tests higher.