Published: 2025-03-20T13:20:38.000Z
Chartbook: Chart USD/CHF: Seen lower into the coming weeks

Senior Technical Strategist
1
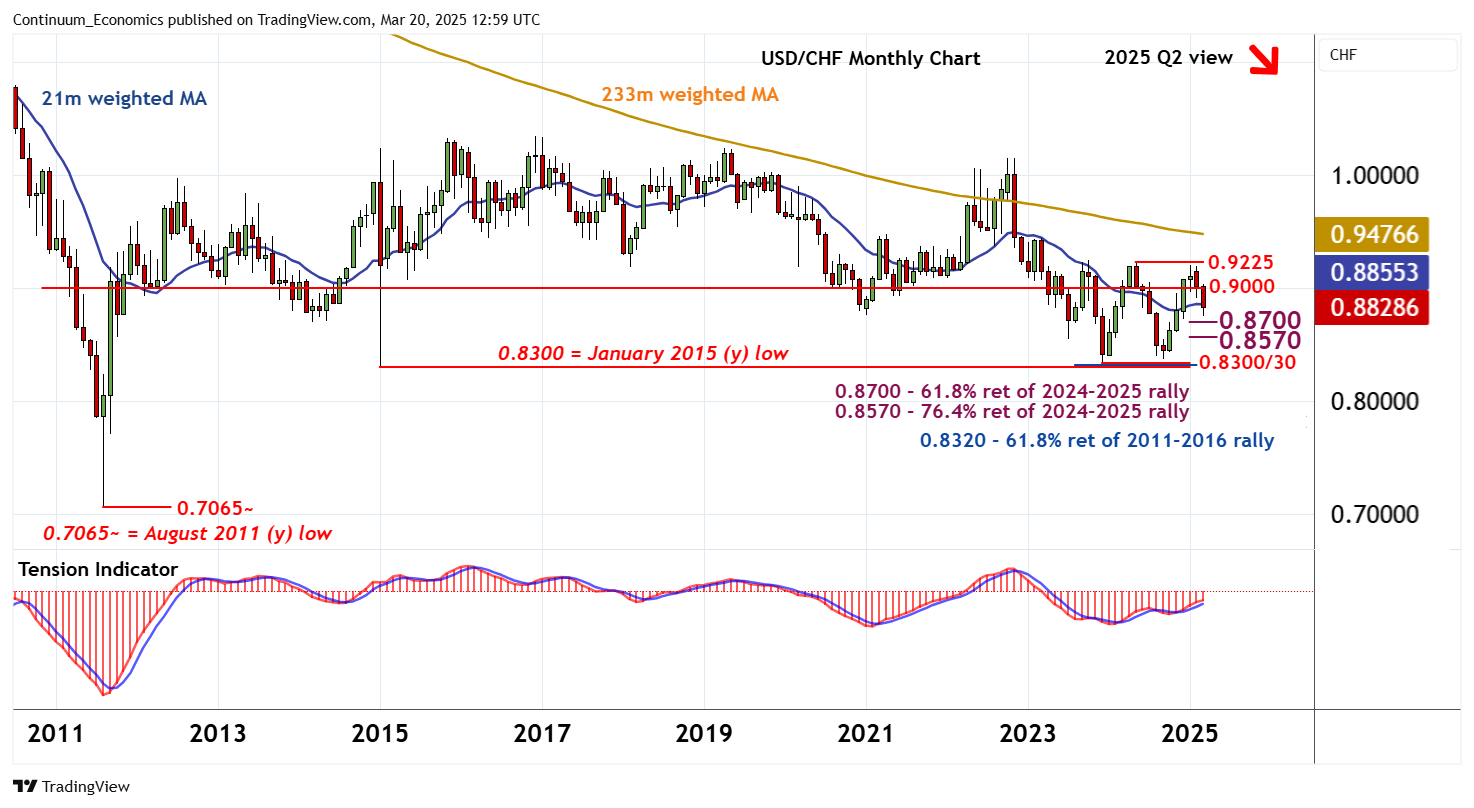
The anticipated test of strong resistance at the 0.9225 year high of May 2024 has been met by expected profit-taking
The anticipated test of strong resistance at the 0.9225 year high of May 2024 has been met by expected profit-taking,

with sharp losses breaking below congestion around 0.9000 to reach 0.8750.
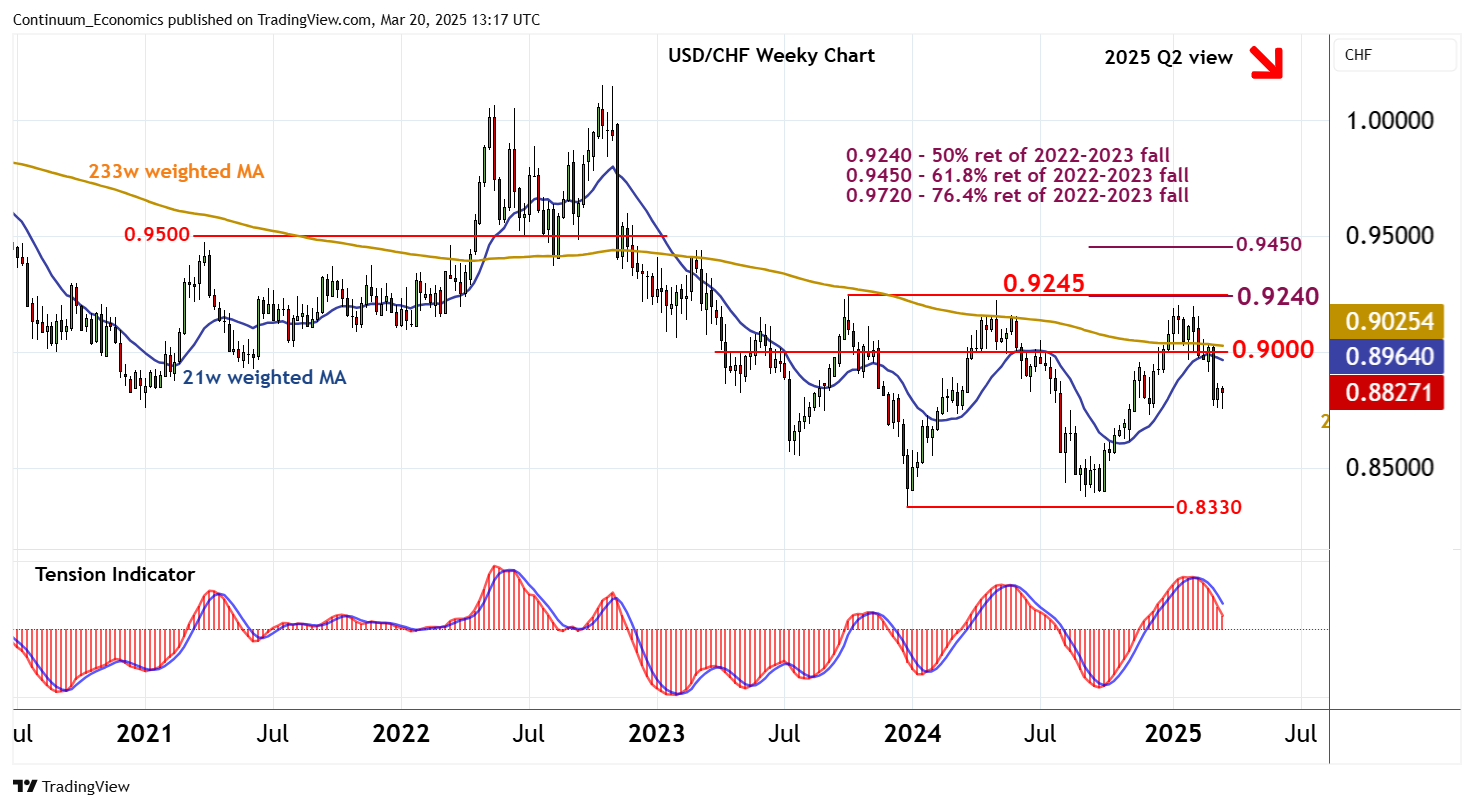
The rising monthly Tension Indicator is prompting a bounce from here, but monthly stochastics are turning lower, unwinding overbought areas, and longer-term charts are turning mixed/negative, suggesting room for further losses into the coming weeks.
Support is at the 0.8700 Fibonacci retracement, with a break beneath here opening up the 0.8570 retracement.
However, any deeper losses should be limited in consolidation above critical support at the 0.8300 year low of January 2015, the 0.8320 multi-year Fibonacci retracement and the 0.8330 year low of December 2023, as mixed longer-term studies keep very broad price action cautious.
Meanwhile, resistance is congestion around 0.9000.

A close above here would stabilise price action and prompt consolidation beneath critical resistance at the 0.9240 Fibonacci retracement and 0.9225.
A further close above here, not seen, would turn sentiment positive and confirm continuation of gains from December 2023, as focus then turns to the 0.9450 Fibonacci retracement and congestion around 0.9500.