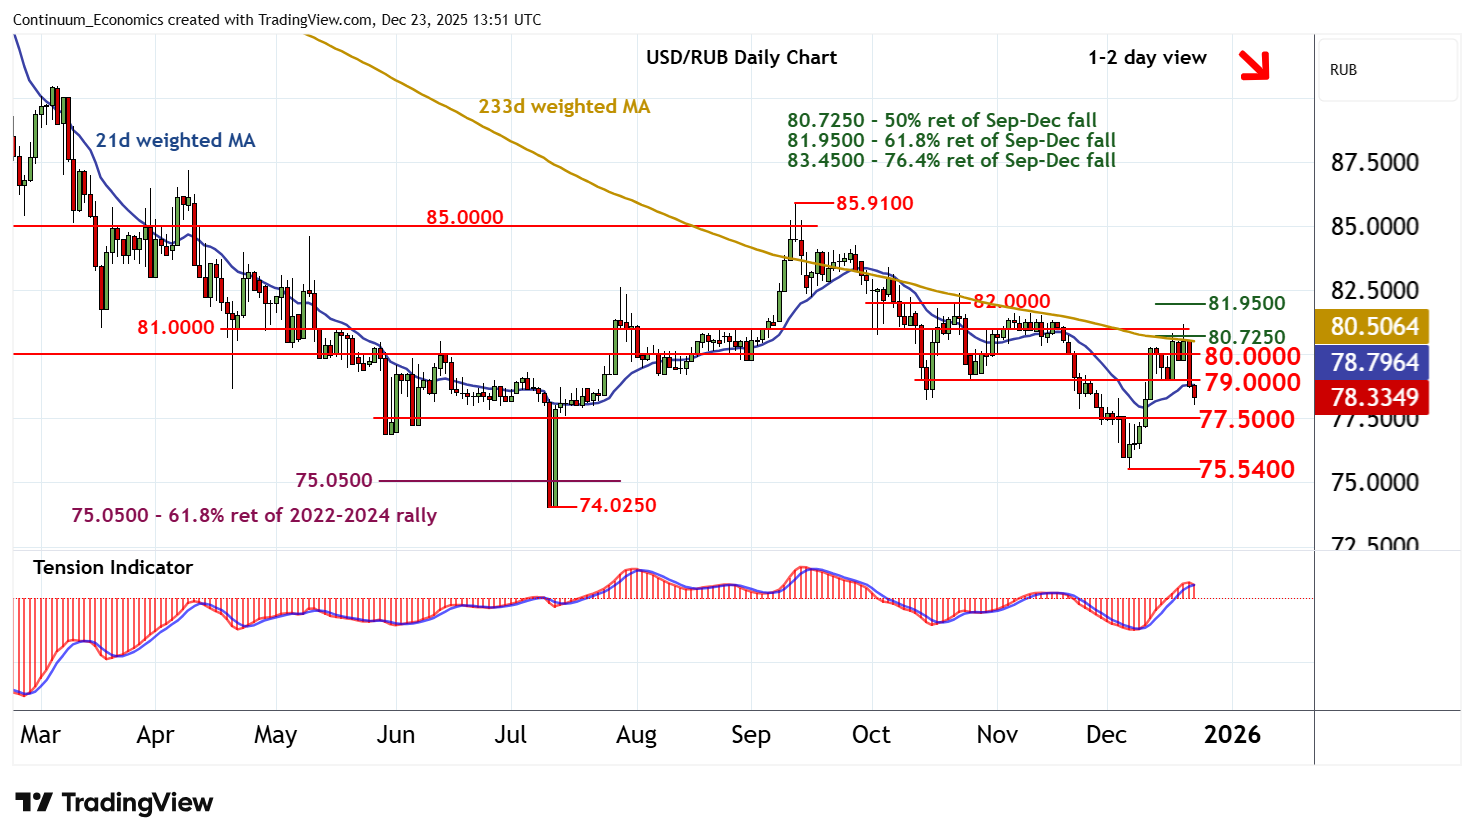
Chart USD/RUB Update: Sharp pullback
The test of resistance at the 80.7250 Fibonacci retracement and congestion around 81.0000 is giving way to a pullback
| Levels | Comment | Levels | Comment | |||||
| R4 | 81.0000 | * | congestion | S1 | 77.5000 | * | congestion | |
| R3 | 80.7250 | * | 50% ret of Sep-Dec fall | S2 | 75.5400 | ** | 5 Dec (w) low | |
| R2 | 80.0000 | ** | congestion | S3 | 75.0500 | ** | 61.8% ret of 2022-2024 rally | |
| R1 | 79.0000 | * | recent lows | S4 | 74.0250 | ** | 10 Jul YTD low |
Asterisk denotes strength of level
13:30 GMT - The test of resistance at the 80.7250 Fibonacci retracement and congestion around 81.0000 is giving way to a pullback, as daily stochastics unwind overbought areas and the positive daily Tension Indicator turns down. Steady selling interest is giving way to consolidation above 78.0000. But a test of congestion support at 77.5000 cannot be ruled out. A break will add weight to sentiment and open up the 75.5400 weekly low of 5 December. But rising weekly charts are expected to limit any tests in renewed consolidation. Meanwhile, resistance is lowered to 79.0000 and extends to 80.0000. This range should cap any immediate tests higher.