Published: 2026-04-17T00:47:02.000Z
Chart NZD/USD Update: Leaning lower in consolidation
1
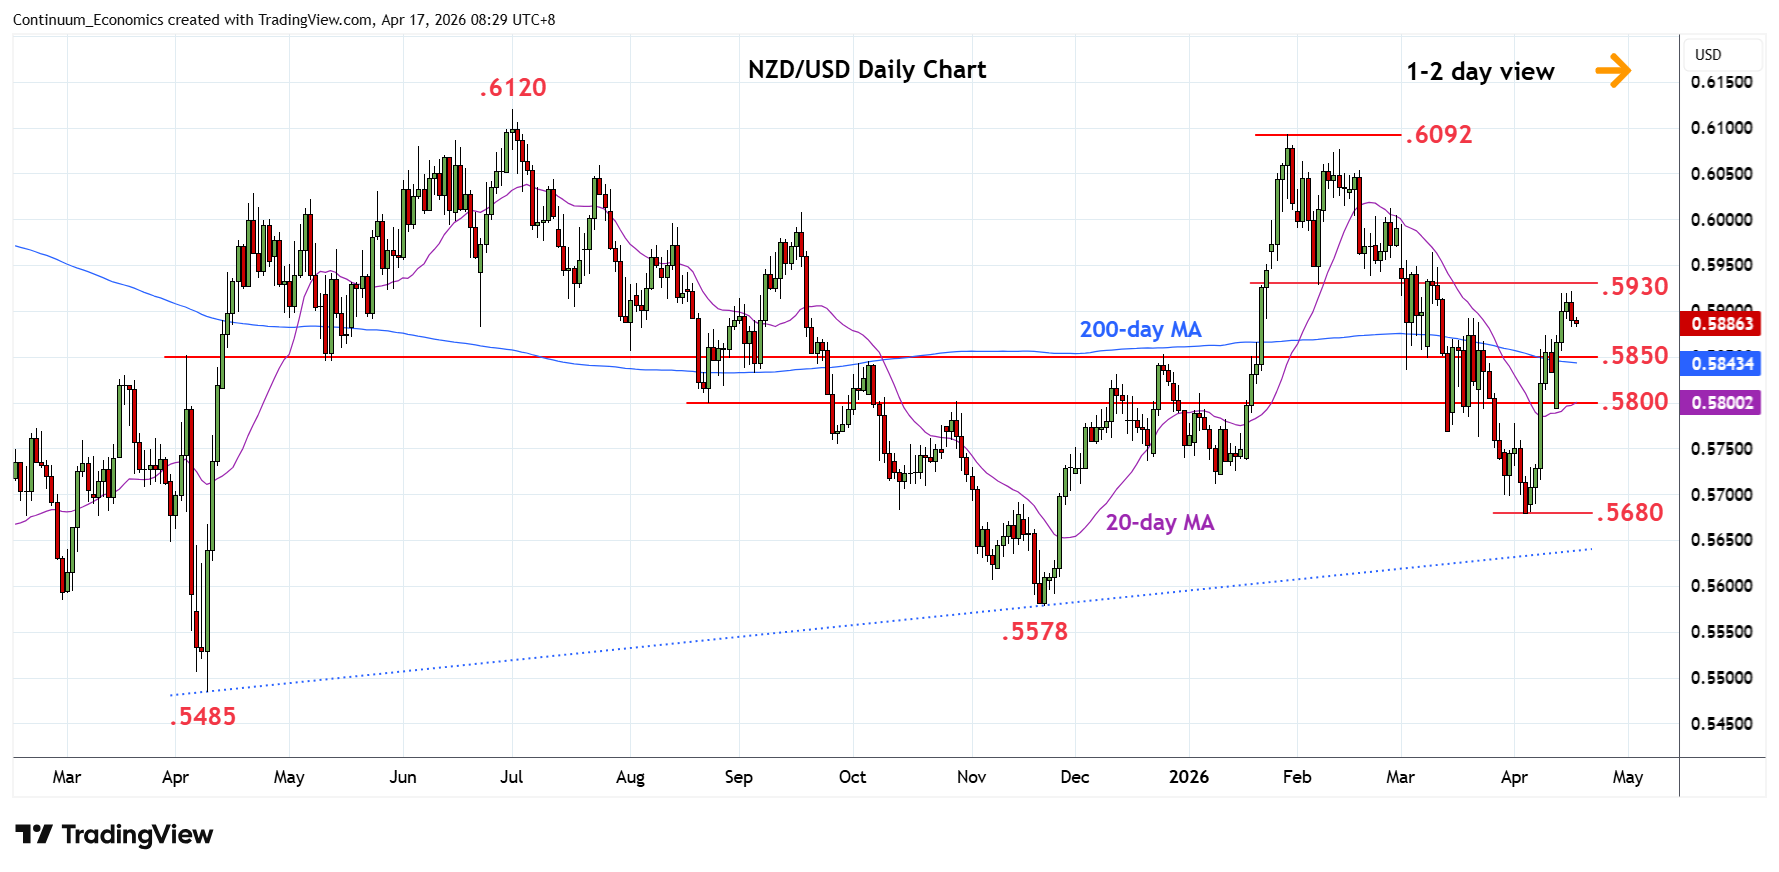
Turned lower from the .5920 high as prices consolidate strong gains from the .5680 low of 3 April
| Levels | Imp | Comment | Levels | Imp | Comment | |||
|---|---|---|---|---|---|---|---|---|
| R4 | .6050 | * | congestion | S1 | .5850 | * | congestion | |
| R3 | .6000/10 | * | congestion, 26 Feb high | S2 | .5800/95 | * | congestion, 13 Apr low | |
| R2 | .5930/50 | ** | Feb low, congestion | S3 | .5750 | * | congestion | |
| R1 | .5920 | 14 Apr high | S4 | .5680 | ** | 3 Apr YTD low |
Asterisk denotes strength of level
00:40 GMT - Turned lower from the .5920 high as prices consolidate strong gains from the .5680 low of 3 April and unwind overbought intraday studies. Daily studies are overbought as well and suggest scope for pullback to support at the .5850 congestion. Below this will open up room for deeper pullback to the .5800/.5795 congestion and 13 April low. Corrective pullback is expected to give way to renewed interest later. Above the .5920 high and see room for extension to strong resistance at the .5930/50 February low and congestion area then the .6000 figure.