Published: 2026-02-10T08:32:52.000Z
Chart GBP/USD Update: Further gains to remain limited
5
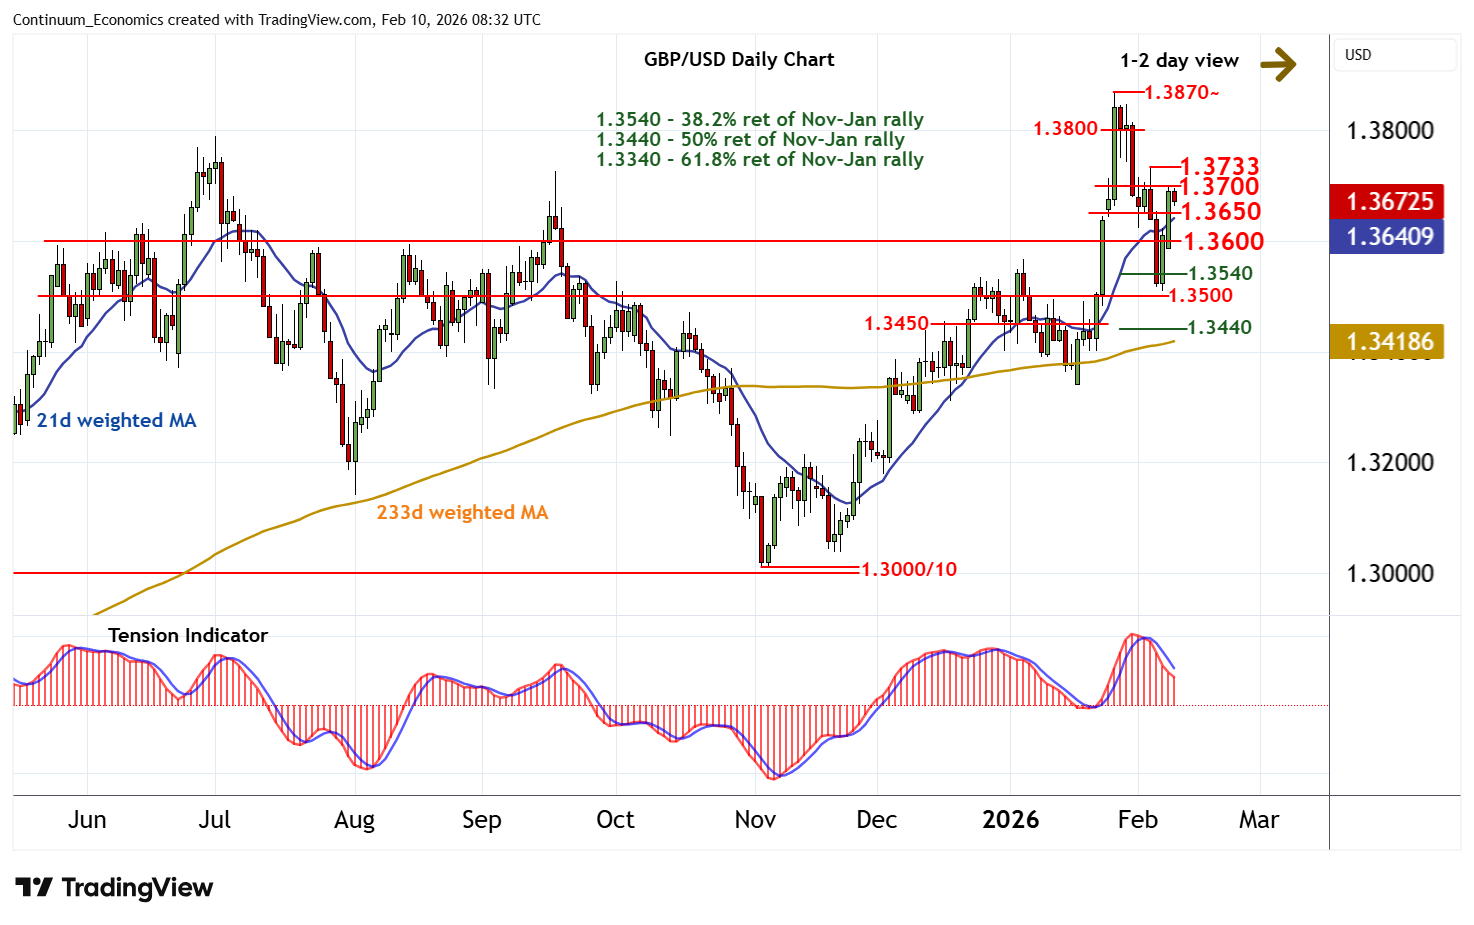
Consolidation around 1.3600 has given way to a steady bounce
| Level | Comment | Level | Comment | |||||
|---|---|---|---|---|---|---|---|---|
| R4 | 1.3870~ | ** | 27 Jan YTD high | S1 | 1.3650 | * | break level | |
| R3 | 1.3800 | * | congestion | S2 | 1.3600 | * | congestion | |
| R2 | 1.3733 | * | 4 Feb (w) high | S3 | 1.3540 | * | 38.2% ret of Nov-Jan rally | |
| R1 | 1.3700 | break level | S4 | 1.3500 | ** | congestion |
Asterisk denotes strength of level
08:10 GMT - Consolidation around 1.3600 has given way to a steady bounce, with prices reaching 1.3700 before settling back as overbought intraday studies unwind. Oversold daily stochastics are turning higher, suggesting room for a test above here. But the bearish daily Tension Indicator and mixed weekly charts should limit scope in renewed selling interest towards the 1.3733 weekly high of 4 February. A close above here, however, will improve price action and extend gains towards 1.3800. Meanwhile, support is raised to 1.3650. A close beneath here will open up congestion around 1.3600, where fresh consolidation is expected to develop.