Continuum Economics
  • Search
  • About Us
  • Buy
  • Invite A Friend
  • My Basket
  • Articles
  • Calendar
  • Forecasts
  • Events
  • Data
  • Newsletters
  • My Alerts
  • Community
  • Directory
  • About Us
  • Buy
  • Invite A Friend
  • My Basket
  • Articles
    • All
    • Thematic
    • Tactical
    • Asia
    • EMEA
    • Americas
    • Newsletters
    • Freemium
    • Editor's Choice
    • Most Viewed
    • Most Shared
    • Most Liked
  • Calendar
    • Interactive
      • China
      • United States
      • Eurozone
      • United Kingdom
    • Month Ahead
    • Reviews
    • Previews
  • Forecasts
    • Forecasts
    • Key Views
  • Events
    • Media
    • Conference Calls
  • Data
    • Country Insights
    • Shadow Credit Ratings
    • Full CI Data Download
  • Newsletters
  • My Alerts
  • Community
    • FX
    • Fixed Income
    • Macro Strategy
    • Credit Markets
    • Equities
    • Commodities
    • Precious Metals
    • Renewables
  • Directory
  • My Account
  • Notifications Setup
  • Account Details
  • Recent Devices
  • Distribution Lists
  • Shared Free Trials
  • Saved Articles
  • Shared Alerts
  • My Posts
Published: 2025-03-21T13:19:25.000Z

Chartbook: Chart EUR/USD: Approaching critical resistance within the 1.1000 - 1.1275 range

byMike Macdonald

Senior Technical Strategist
-

The anticipated test of strong support at the 1.0200 Fibonacci retracement has given way to a steady bounce

The anticipated test of strong support at the 1.0200 Fibonacci retracement has given way to a steady bounce,

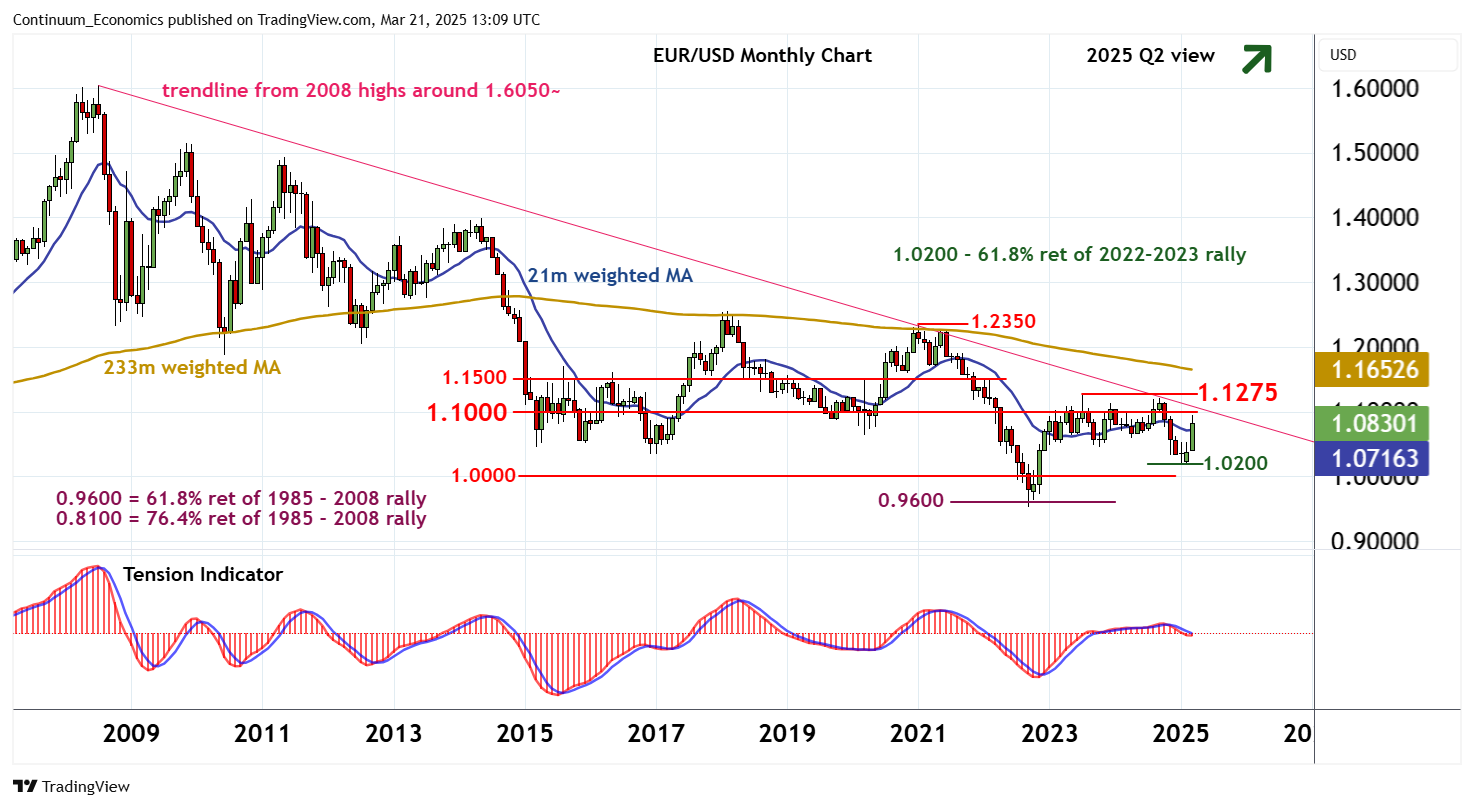
as oversold monthly stochastics unwind, with prices currently trading around 1.0830.

Focus is on strong resistance at congestion around 1.1000, but the flat monthly Tension Indicator is expected to limit any immediate break in renewed consolidation beneath critical resistance at the 1.1275 year high of July 2023 and the falling trendline from the July 2008 year high around 1.6050.

Longer-term studies are improving, but a close above 1.1275 is needed to confirm a more significant rally and extend the gains from the September 2022 multi-year low. Initial focus will then turn to congestion around 1.1500.

Meanwhile, support is at the 1.0500 break level.

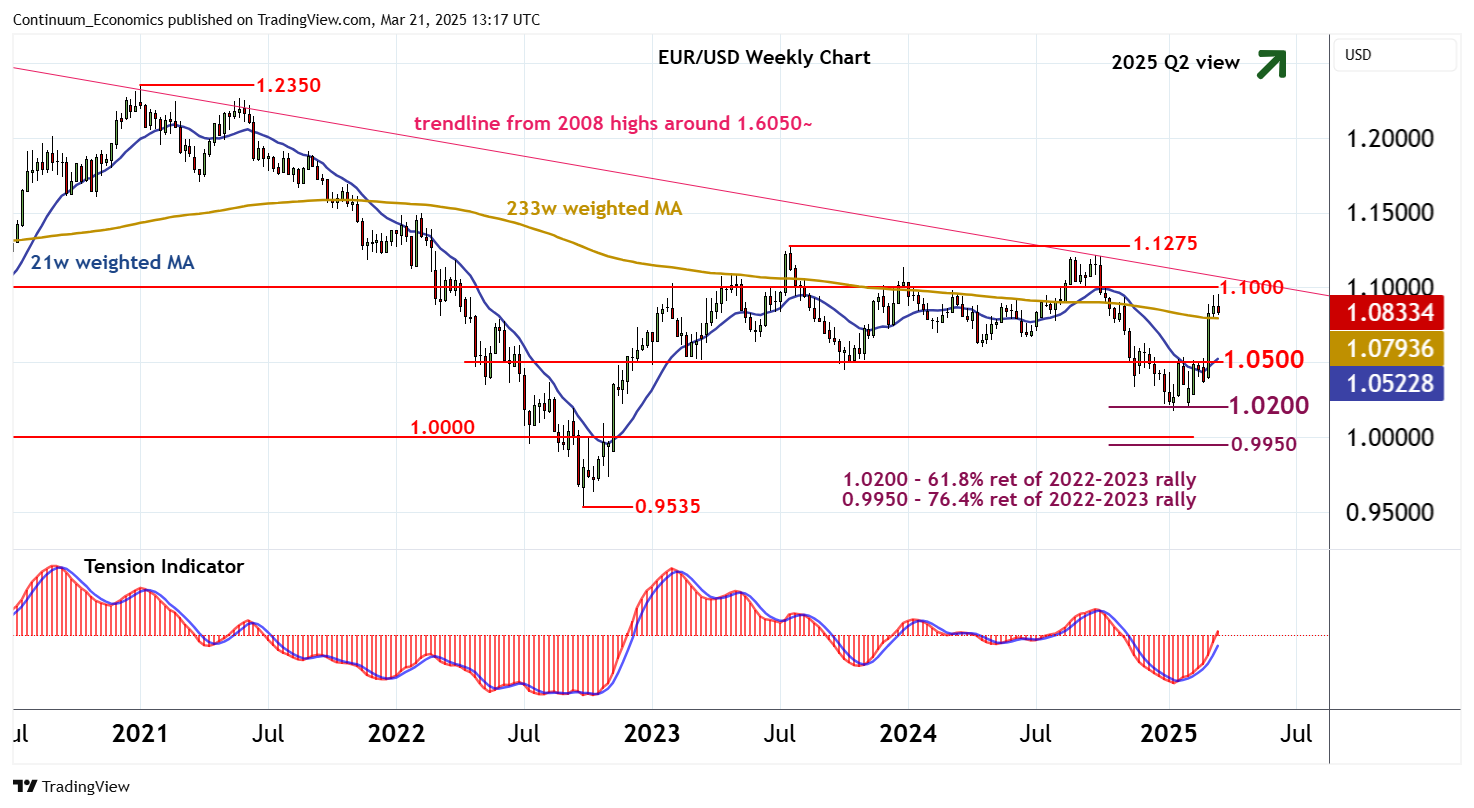
Rising weekly charts are expected to limit any immediate pullback in renewed buying interest above here.

However, a close below 1.0500 will add weight to sentiment and open up critical support at the 1.0200 retracement. A further close beneath here, not seen, would turn sentiment negative and extend losses towards parity and the 0.9950 retracement, where fresh buying interest/consolidation is expected to appear.

Continue to read the article for free
Login

or

or

Topics
EUR/USD-TA
Technical Analysis
ChartBook

GENERAL

  • Home
  • About Us
  • Our Team
  • Careers

LEGAL

  • Terms and Conditions
  • Privacy Policy
  • Compliance
  • GDPR

GET IN TOUCH

  • Contact Us
Continuum Economics
The Technical Analyst Awards Winner 2021
The Technical Analyst Awards Finalist 2020
image