Chart USD Index DXY Update: Limited tests higher
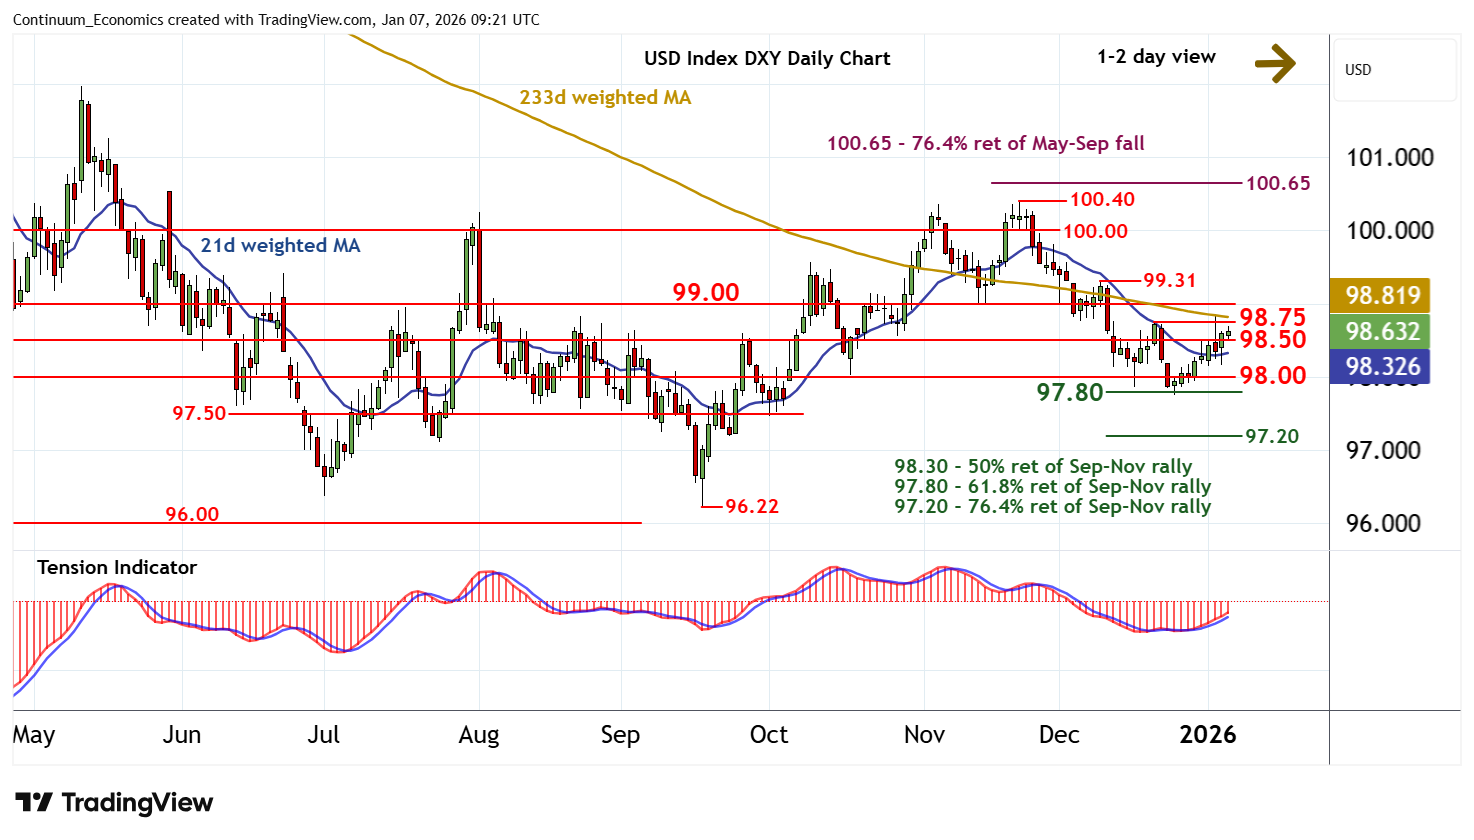
Little change, as prices extend consolidation following the break above 98.50
| Levels | Imp | Comment | Levels | Imp | Comment | |||
|---|---|---|---|---|---|---|---|---|
| R4 | 100.00 | ** | congestion | S1 | 98.50 | * | congestion | |
| R3 | 99.31 | * | 9 Dec (w) high | S2 | 98.00 | * | congestion | |
| R2 | 99.00 | * | congestion | S3 | 97.80 | ** | 61.8% ret of Sep-Nov rally | |
| R1 | 98.75 | * | 19 Dec (w) high | S4 | 97.50 | congestion |
Asterisk denotes strength of level
09:05 GMT - Little change, as prices extend consolidation following the break above 98.50. Immediate focus is on the 98.75 weekly high of 19 December. The rising daily Tension Indicator highlights potential for a test above here. But flattening overbought daily stochastics and bearish weekly readings are expected to limit scope in renewed selling interest towards congestion around 99.00. Meanwhile, support is raised to congestion around 98.50. A later close beneath here will help to stabilise price action. A further close below support at the 97.80 Fibonacci retracement and congestion around 98.00 will add weight to sentiment and extend November losses below congestion around 97.50 towards the 97.20 retracement.