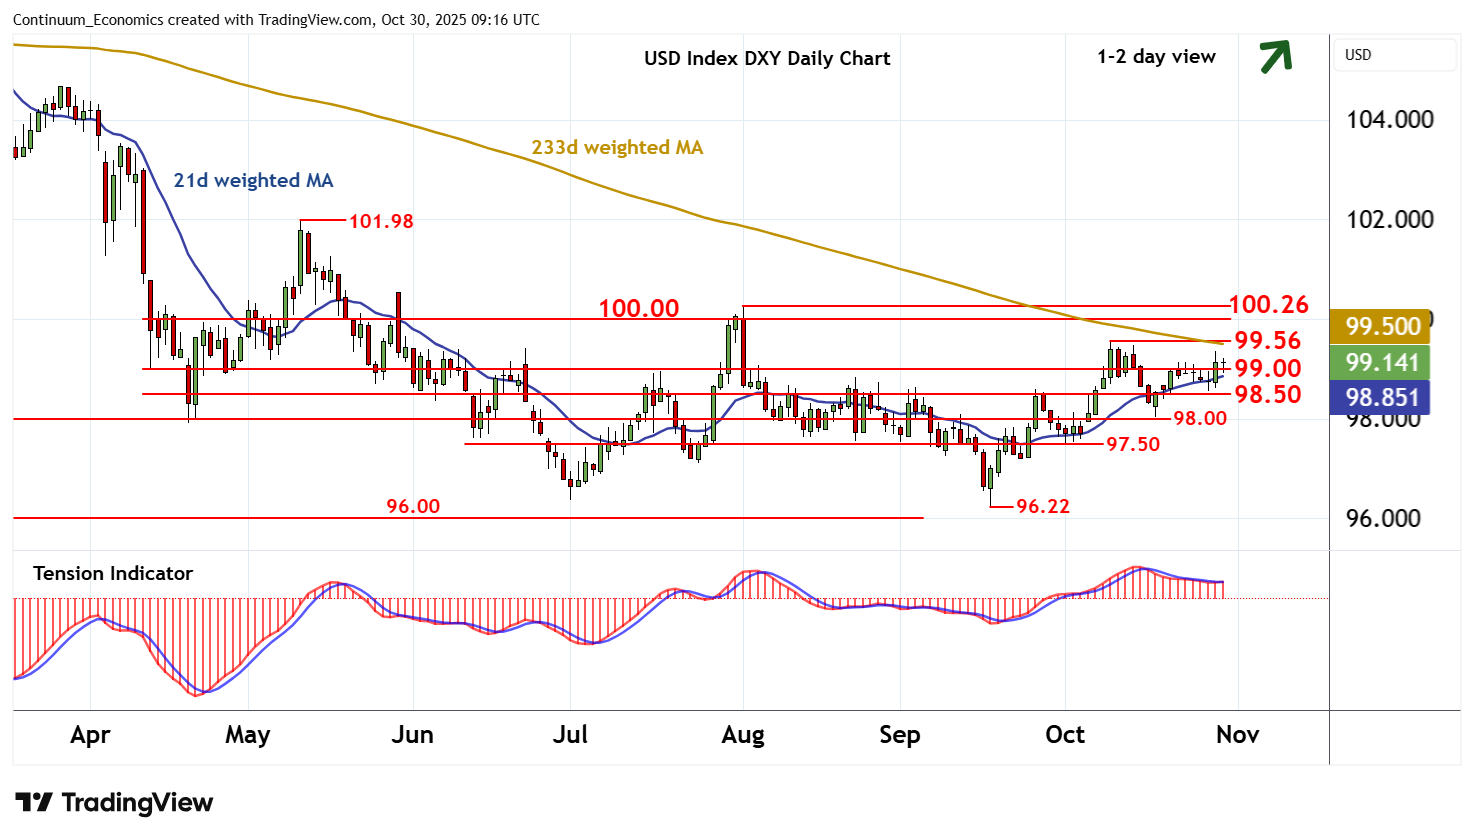
Chart USD Index DXY Update: Consolidating sharp gains - studies improving
The anticipated break above 99.00 has reached 99.36
| Levels | Imp | Comment | Levels | Imp | Comment | |||
|---|---|---|---|---|---|---|---|---|
| R4 | 100.26 | ** | 1 Aug (m) high | S1 | 99.00 | * | congestion | |
| R3 | 100.00 | ** | congestion | S2 | 98.50 | * | congestion | |
| R2 | 99.56 | ** | 9 Oct (w) high | S3 | 98.00 | * | congestion | |
| R1 | 99.36 | 29 Oct high | S4 | 97.50 | * | congestion |
Asterisk denotes strength of level
09:00 GMT - The anticipated break above 99.00 has reached 99.36, where mixed intraday studies are prompting a pullback and consolidation above congestion support at 99.00. Daily readings have turned positive, highlighting room for further strength. But flat overbought weekly stochastics are expected to limit initial scope in consolidation beneath stronger resistance at the 99.56 weekly high of 9 October, before the rising weekly Tension Indicator prompts a break. A close above 99.56 will improve price action and extend mid-September gains towards 100.00/26. Meanwhile, a close below 99.00 will stabilise price action and prompt consolidation above further congestion around 98.50.