Published: 2026-04-14T08:13:30.000Z
Chart USD Index DXY Update: Extending late-March losses
4
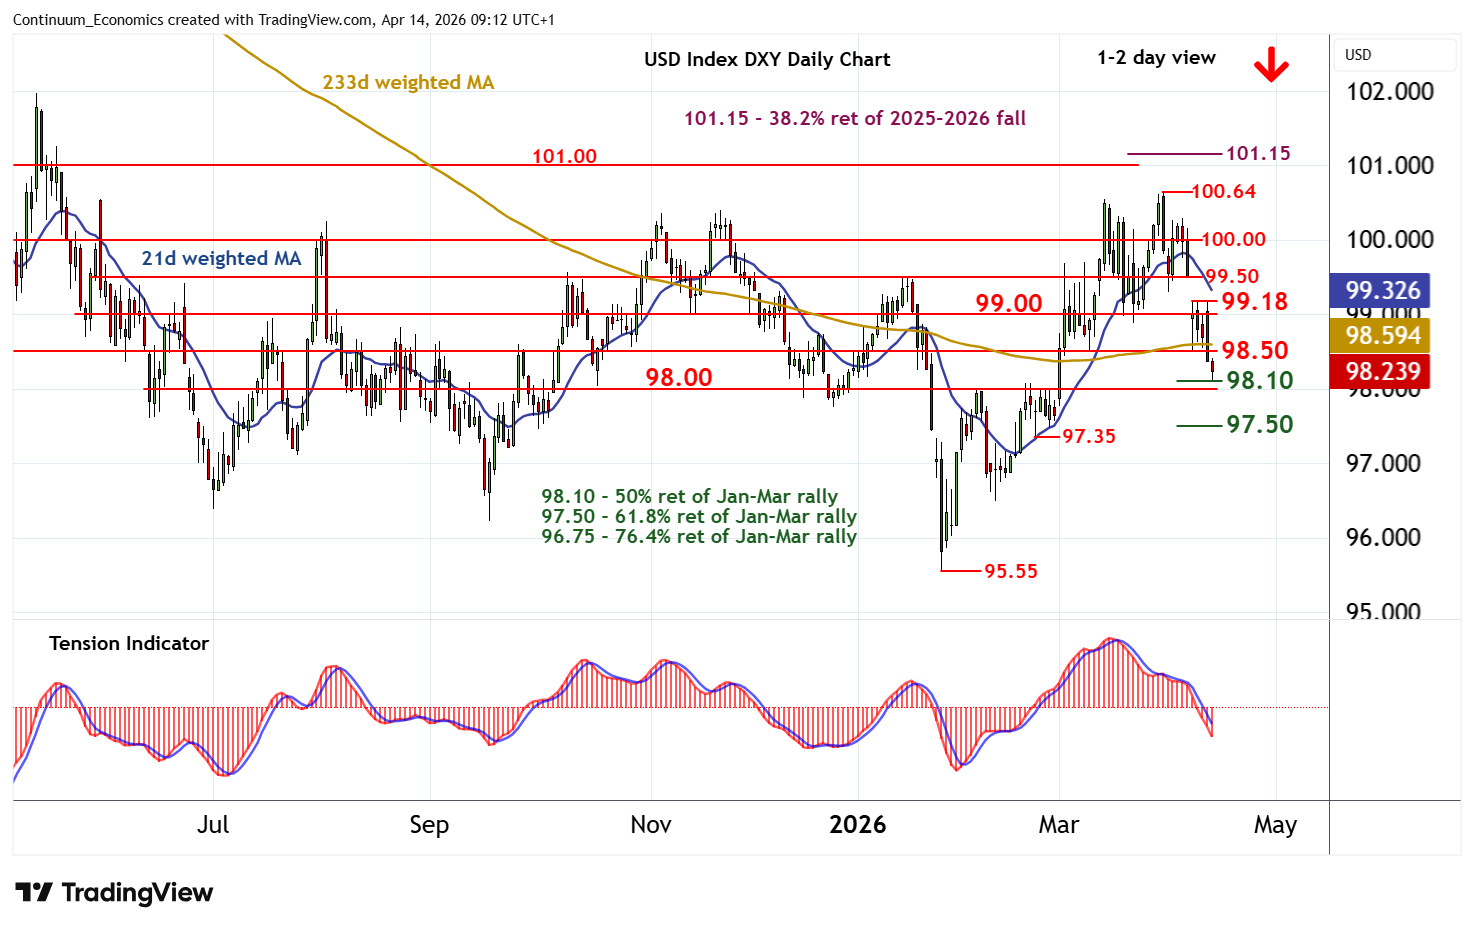
Selling interest is extending
| Levels | Imp | Comment | Levels | Imp | Comment | |||
|---|---|---|---|---|---|---|---|---|
| R4 | 100.00 | ** | congestion | S1 | 98.00/10 | ** | congestion; 50% ret | |
| R3 | 99.50 | * | congestion | S2 | 97.50 | ** | congestion; 61.8% ret | |
| R2 | 99.00/18 | ** | congestion; 8 Apr high | S3 | 97.35 | * | 23 Feb (w) low | |
| R1 | 98.50 | * | congestion | S4 | 97.00 | * | congestion |
Asterisk denotes strength of level
08:50 BST - Selling interest is extending, with prices reaching support at the 98.10 Fibonacci retracement. Just lower is congestion around 98.00. Minor consolidation is developing above 98.00/10, as oversold daily stochastics flatten. But the bearish daily Tension Indicator and deteriorating weekly charts highlight room for further losses. A close beneath here will add weight to sentiment and extend late-March losses towards 97.50. Meanwhile, resistance is lowered to congestion around 98.50. A close above here, if seen, will help to stabilise price action and prompt consolidation beneath 99.00/18.