Chart USD/ZAR Update: Extending corrective gains

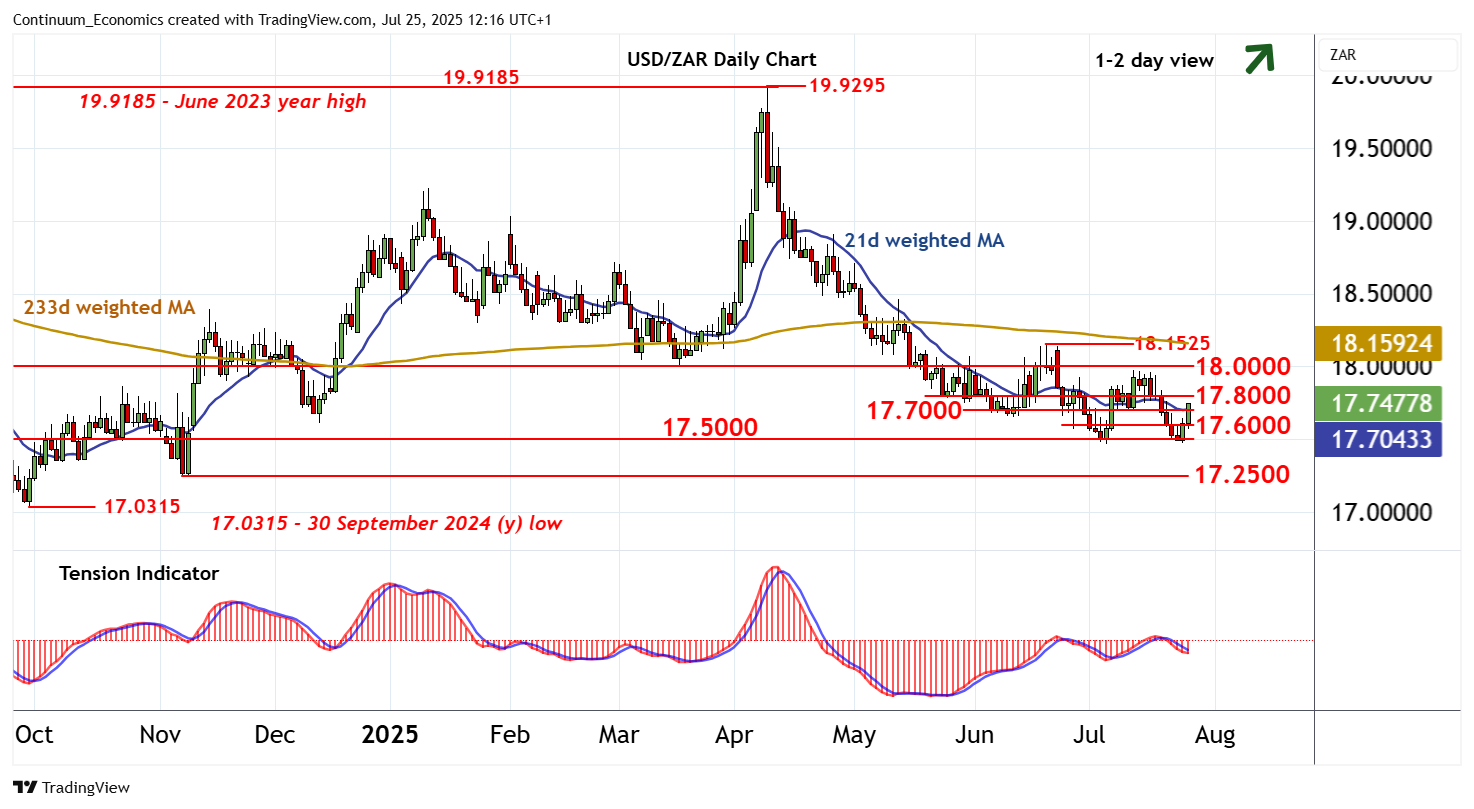
Anticipated gains have reached congestion resistance within the 17.7000-17.8000 range
| Level | Comment | Level | Comment | |||||
|---|---|---|---|---|---|---|---|---|
| R4 | 18.1525 | ** | 19 Jun (m) high | S1 | 17.6000 | * | congestion | |
| R3 | 18.0000 | ** | congestion | S2 | 17.5000 | ** | congestion | |
| R2 | 17.8000 | * | congestion | S3 | 17.2500 | ** | 7 Nov (m) low | |
| R1 | 17.7000 | * | congestion | S4 | 17.0315 | ** | 30 Sep 2024 (y) low |
Asterisk denotes strength of level
11:55 BST - Anticipated gains have reached congestion resistance within the 17.7000-17.8000 range, with prices currently trading around 17.7400. Negative daily readings are flattening and weekly stochastics are turning higher, suggesting room for a test of 17.8000. But the bearish weekly Tension Indicator and negative longer-term charts are expected to limit any continuation beyond here in renewed selling interest towards further congestion around 18.0000. Meanwhile, support is raised to congestion around 17.6000 and extends to 17.5000. A close beneath here is needed to turn sentiment negative and post fresh year lows, as April losses extend towards the 17.2500 monthly low of 7 November.