Published: 2026-01-14T14:40:47.000Z
Chart AUD/USD Update: Limited downside tests
2
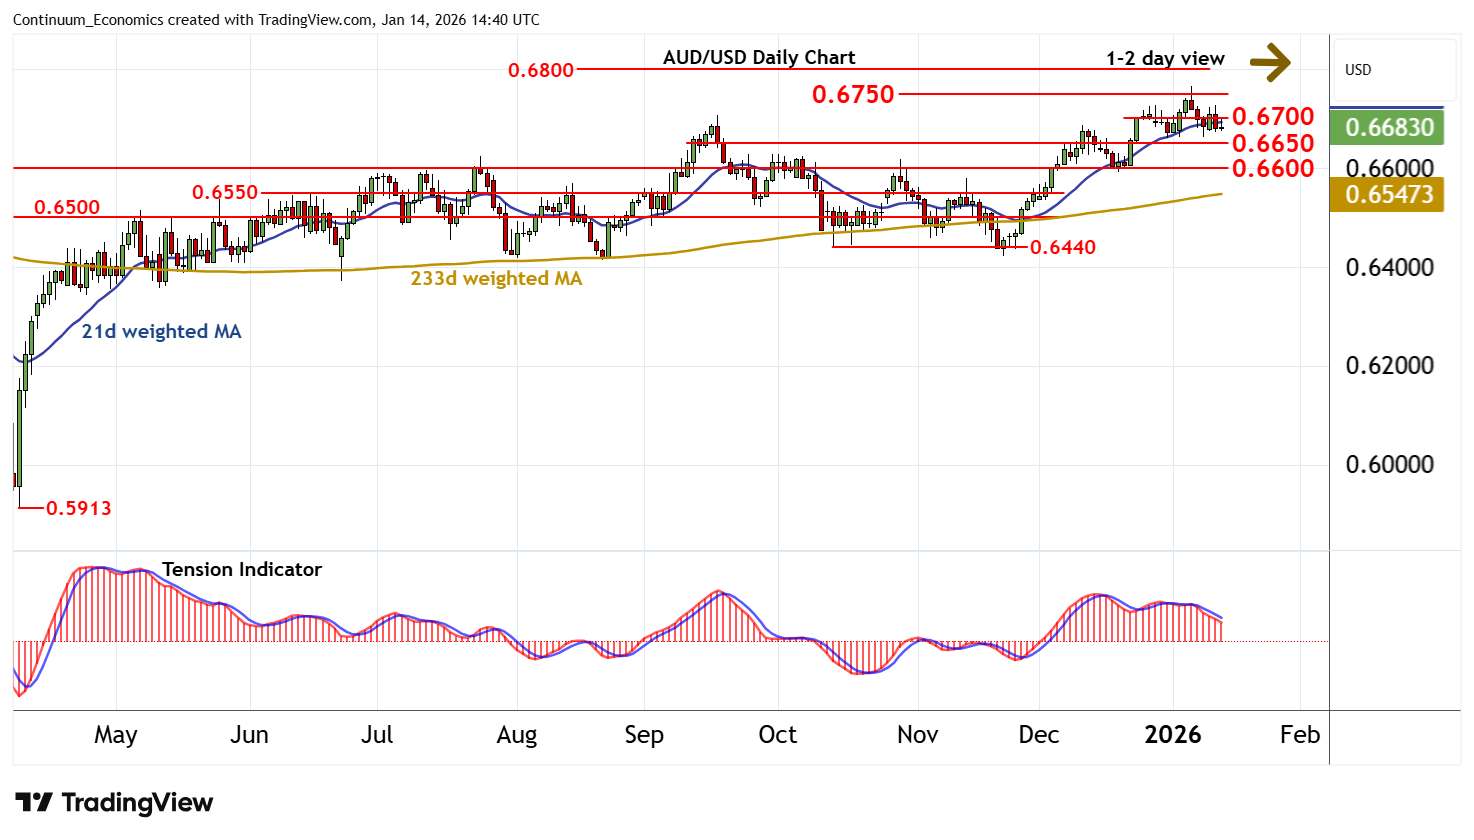
Still little change, as the break below 0.6700 gives way to fresh consolidation above congestion support at 0.6650
| Levels | Imp | Comment | Levels | Imp | Comment | |||
|---|---|---|---|---|---|---|---|---|
| R4 | 0.6800 | ** | break level | S1 | 0.6650 | congestion | ||
| R3 | 0.6765~ | * | 7 Jan YTD high | S2 | 0.6600 | ** | congestion | |
| R2 | 0.6750 | * | congestion | S3 | 0.6550 | * | congestion | |
| R1 | 0.6700 | * | congestion | S4 | 0.6500 | ** | congestion |
Asterisk denotes strength of level
14:30 GMT - Still little change, as the break below 0.6700 gives way to fresh consolidation above congestion support at 0.6650. Daily readings are under pressure and overbought weekly stochastics are turning down, highlighting room for a test of 0.6650. But the positive weekly Tension Indicator and rising longer-term charts should limit any break in renewed buying interest/consolidation above 0.6600. Meanwhile, resistance is at congestion around 0.6700 and extends to 0.6750. This range should cap any immediate tests higher.