Published: 2026-04-02T00:25:01.000Z
Chart AUD/USD Update: Consolidating
-
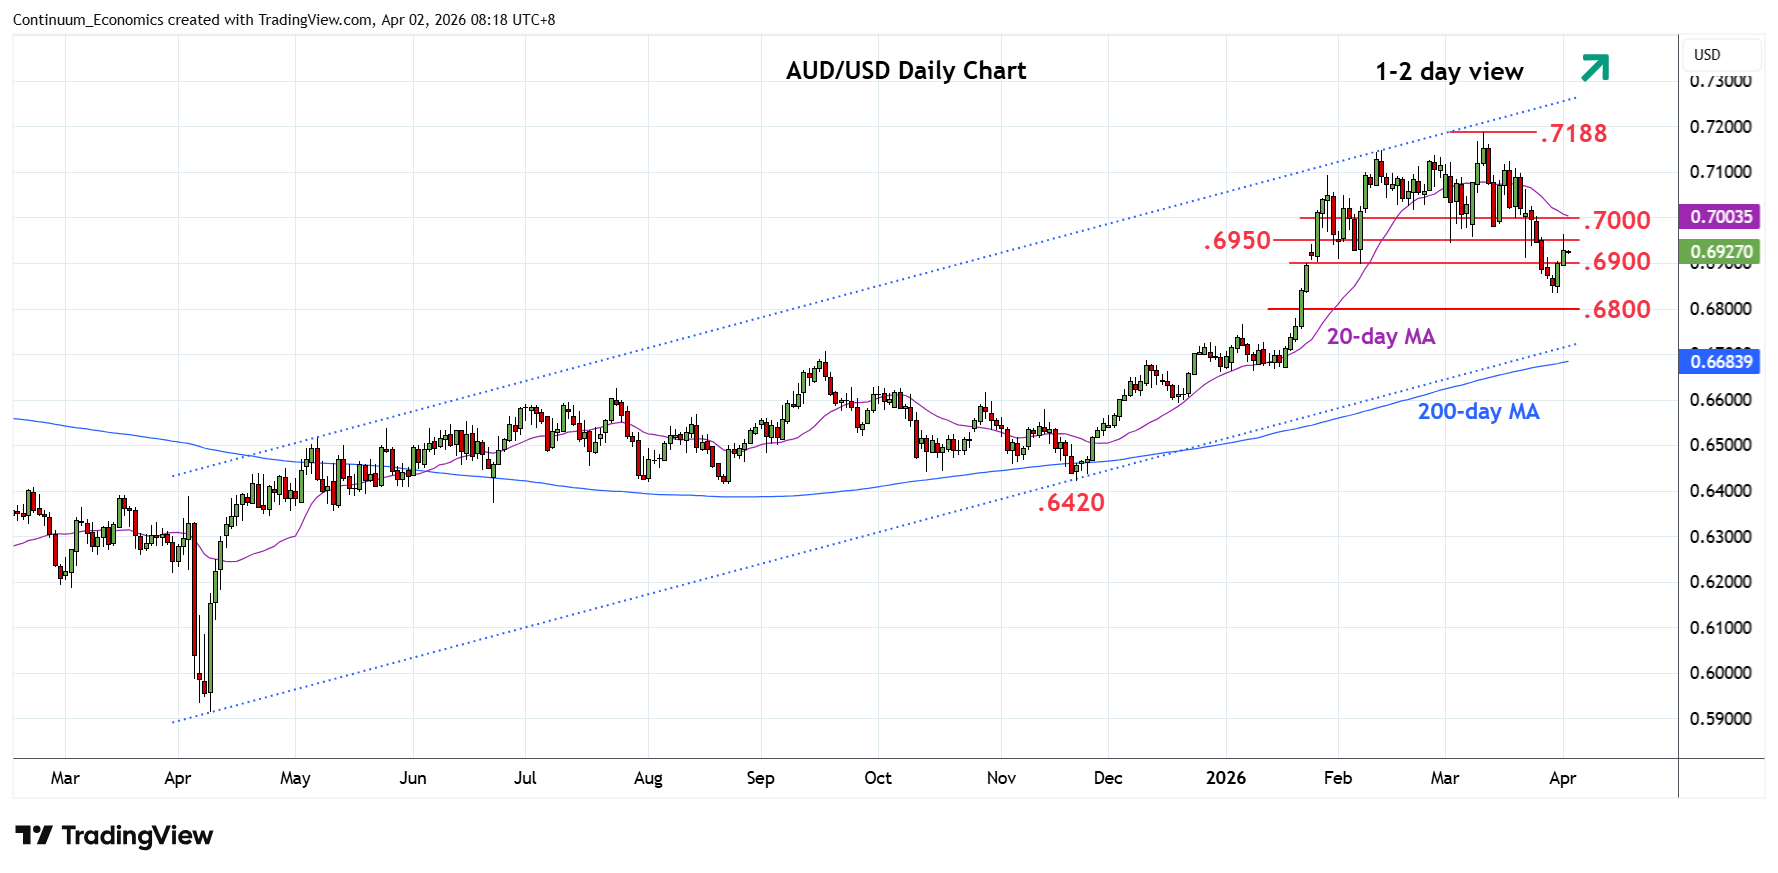
Settled back from test of resistance at .6950 but upside bias remains following bounce from the .6833 low
| Levels | Imp | Comment | Levels | Imp | Comment | |||
|---|---|---|---|---|---|---|---|---|
| R4 | 0.7050 | * | congestion | S1 | 0.6833 | ** | 30 Mar low | |
| R3 | 0.7000 | ** | congestion | S2 | 0.6805 | * | 50% Nov/Mar rally | |
| R2 | 0.6980 | * | 13 Mar low | S3 | 0.6765 | * | 7 Jan high | |
| R1 | 0.6950 | * | congestion | S4 | 0.6765 | * | 61.8%, congestion |
Asterisk denotes strength of level
00:20 GMT - Settled back from test of resistance at .6950 but upside bias remains following bounce from the .6833 low as daily studies unwind oversold readings. Higher will see room to resistance at the .6980/.7000, 13 March low and congestion area which is expected to cap. Gains are expected to give way to renewed selling pressure later with support raised to the .6900 level then the .6833 low. A later break of these will see room for extension to .6805 50% Fibonacci level. Lower still, still see scope to strong support zone at .6715/.6700 area and channel support.