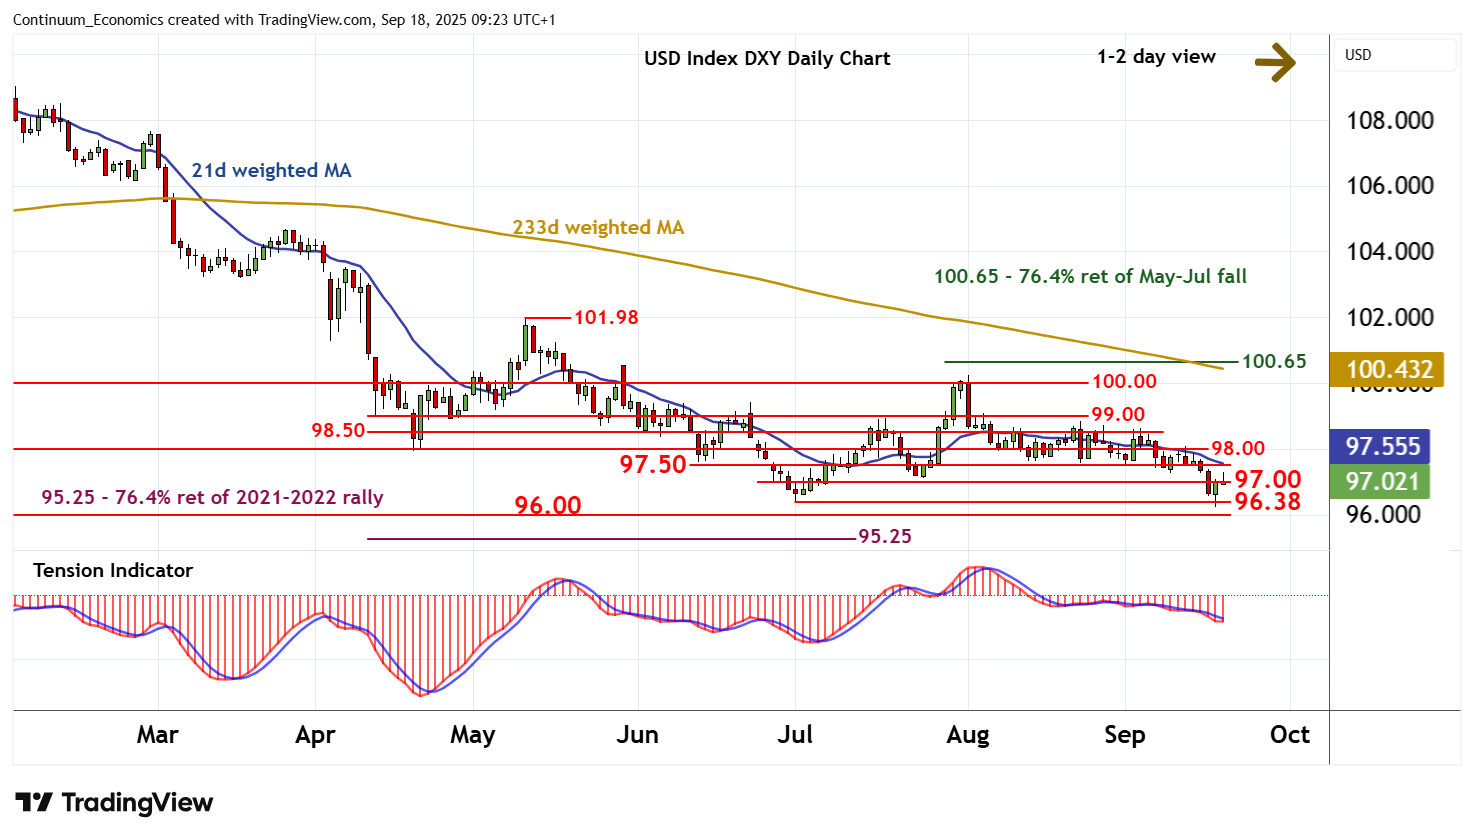
Chart USD Index DXY Update: Choppy above fresh 2025 year low
The break below the 96.38 monthly low of 1 July has posted a fresh 2025 year low at 96.22
| Levels | Imp | Comment | Levels | Imp | Comment | |||
|---|---|---|---|---|---|---|---|---|
| R4 | 98.50 | congestion | S1 | 96.38 | ** | 1 Jul (m) low | ||
| R3 | 98.00 | * | congestion | S2 | 96.22 | 17 Sep YTD low | ||
| R2 | 97.50 | * | congestion | S3 | 96.00 | * | historic congestion | |
| R1 | 97.00 | * | congestion | S4 | 95.25 | ** | 76.4% ret of 2021-2022 rally |
Asterisk denotes strength of level
09:10 BST - The break below the 96.38 monthly low of 1 July has posted a fresh 2025 year low at 96.22, before bouncing sharply in volatile trade towards congestion resistance at 97.00. Oversold daily stochastics are unwinding and the bearish daily Tension Indicator is flattening, suggesting room for continuation towards further congestion around 97.50. But deteriorating weekly charts are expected to prompt renewed selling interest towards here. Following choppy trade, fresh losses are looked for. A close below 96.22/38 will add weight to sentiment and extend January losses below 96.00 towards the 95.25 Fibonacci retracement.