Published: 2026-03-30T07:16:55.000Z
Chart EUR/AUD Update: Pressuring 1.6765/1.6800 resistance
1
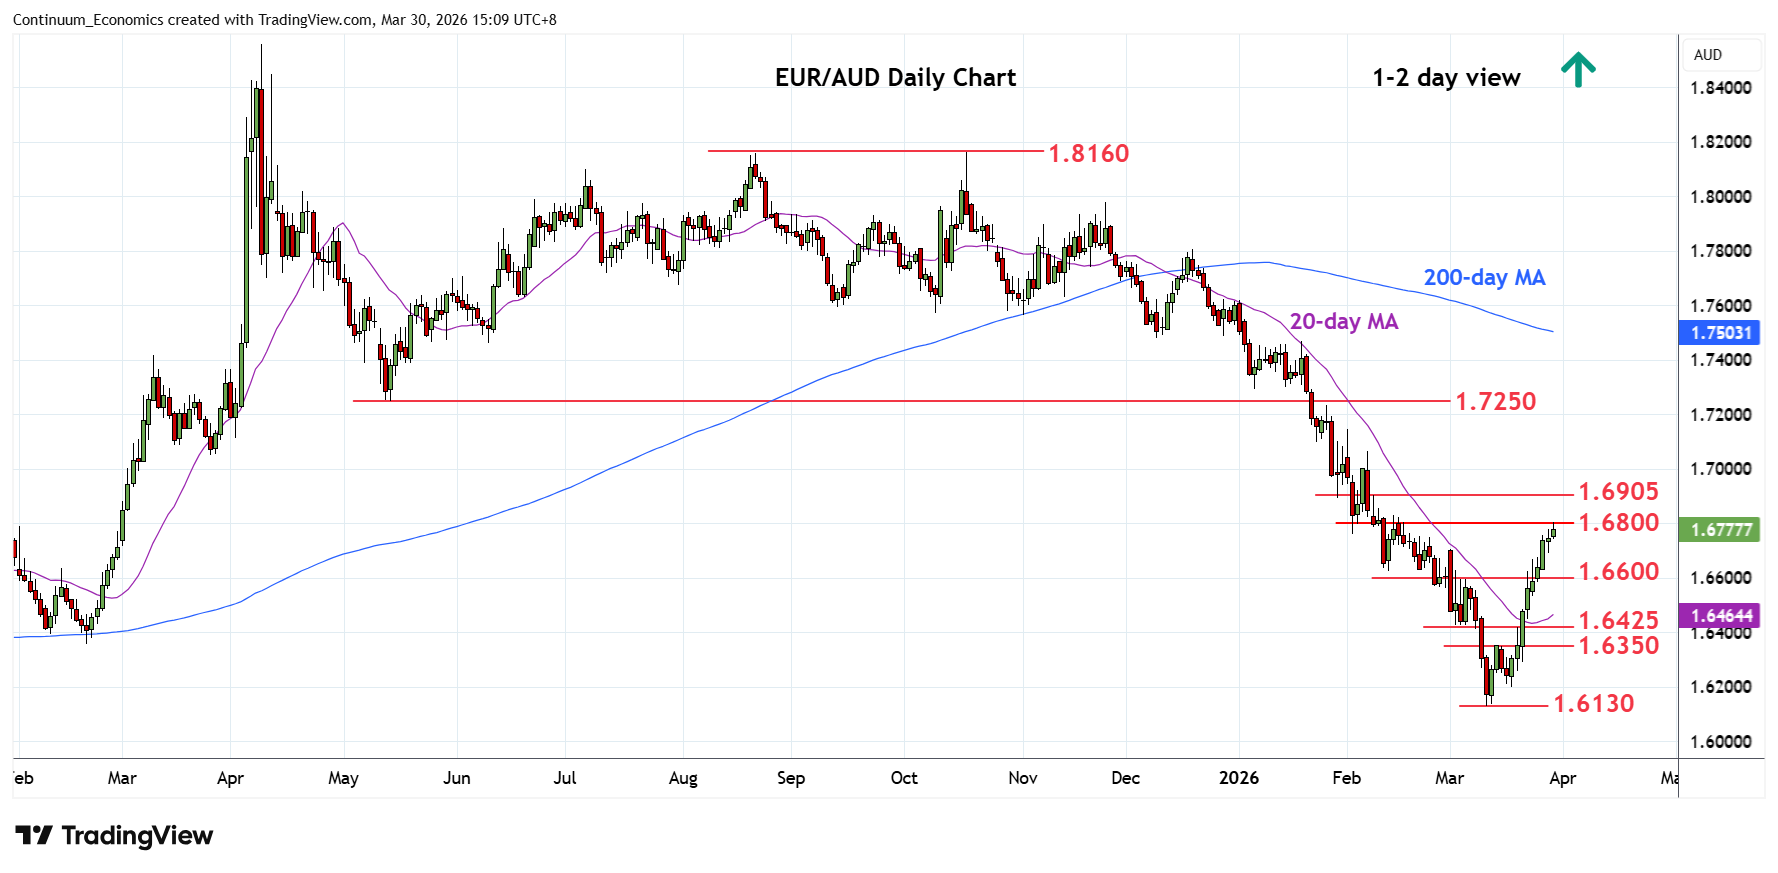
Pressure remains on the upside with gains reaching resistance at the 1.6765/1.6800 congestion
| Levels | Imp | Comment | Levels | Imp | Comment | |||
|---|---|---|---|---|---|---|---|---|
| R4 | 1.7145 | * | 50% Oct/Mar fall | S1 | 1.6700 | * | congestion | |
| R3 | 1.7000/50 | * | figure, congestion | S2 | 1.6620/00 | * | 12 Feb low, congestion | |
| R2 | 1.6900/05 | ** | congestion, 38.2% | S3 | 1.6500 | congestion | ||
| R1 | 1.6800 | * | congestion | S4 | 1.6425 | * | 5 Mar low |
Asterisk denotes strength of level
07:15 GMT - Pressure remains on the upside with gains reaching resistance at the 1.6765/1.6800 congestion. Break here will see room to further retrace the October/March losses and see scope to 1.6905, 38.2% Fibonacci retracement. Higher still, will see room to the 1.7000 figure and 1.7050 congestion. Meanwhile, support is raised to the 1.6700 level and this extend to the 1.6620/00 area which is expected to underpin. Break here will ease the upside pressure and see room for pullback to support at the 1.6500/1.6425 area.