Published: 2026-02-05T00:16:27.000Z
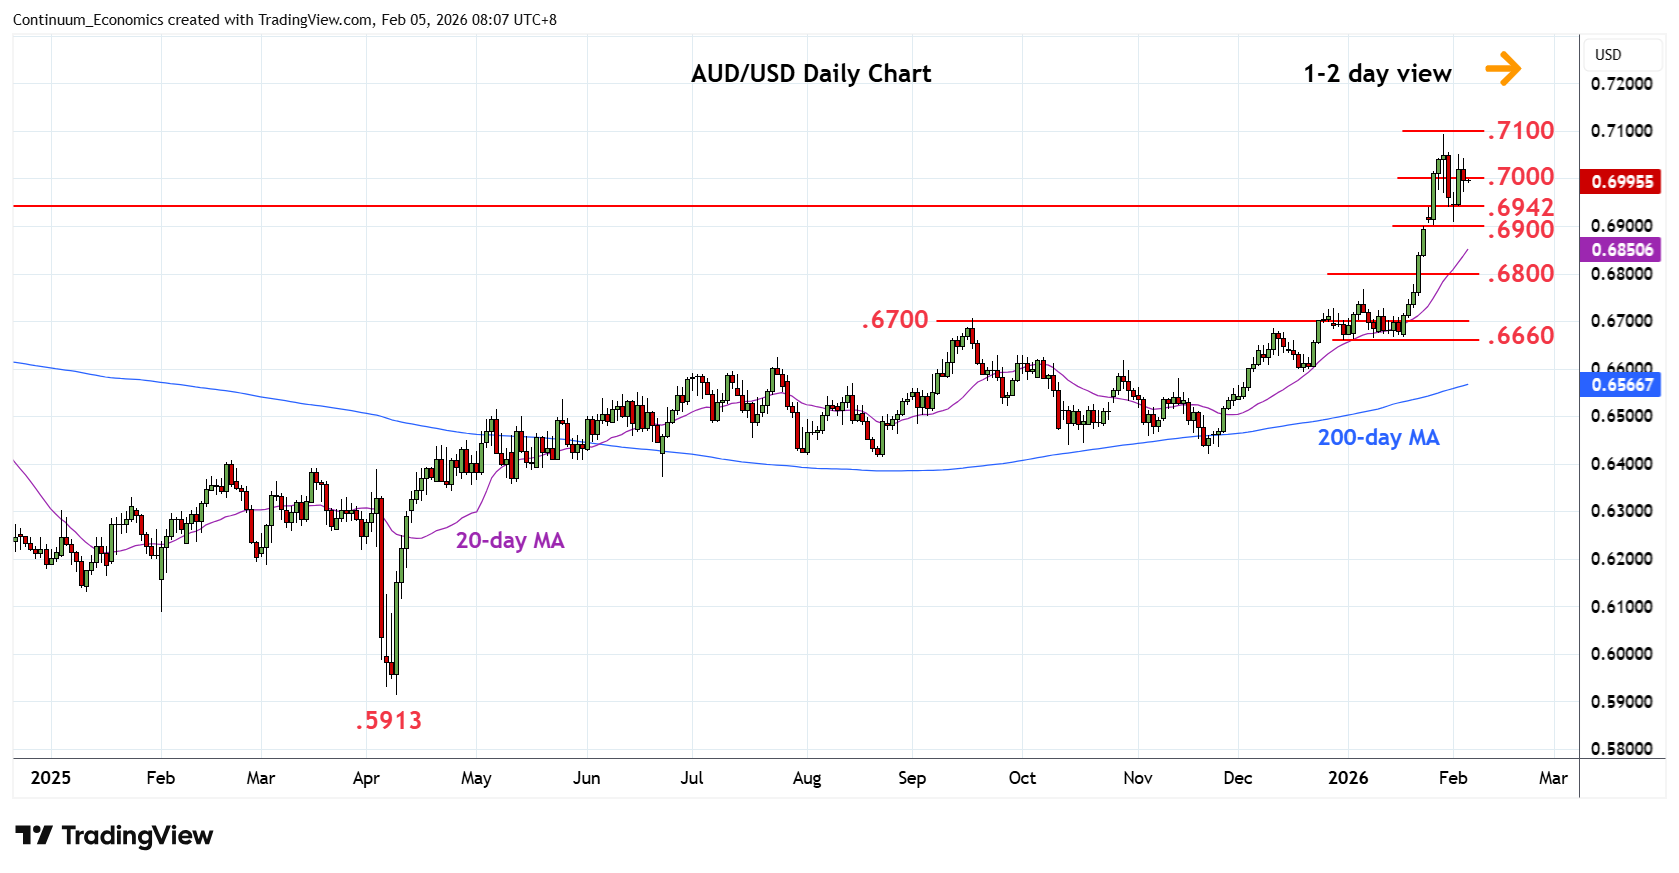
Chart AUD/USD Update: Extend consolidation around .7000
-
Little change, as prices settled back from test of resistance at .7050 to consolidate around the .7000 level
| Levels | Imp | Comment | Levels | Imp | Comment | |||
|---|---|---|---|---|---|---|---|---|
| R4 | 0.7210 | * | 61.8% 2021/2025 fall | S1 | 0.6942 | * | 2024 year high | |
| R3 | 0.7158 | ** | Feb 2023 year high | S2 | 0.6900 | ** | 23 Jan high, gap | |
| R2 | 0.7094 | ** | 29 Jan YTD high | S3 | 0.6850 | * | congestion | |
| R1 | 0.7050 | * | congestion | S4 | 0.6800 | * | congestion |
Asterisk denotes strength of level
00:10 GMT - Little change, as prices settled back from test of resistance at .7050 to consolidate around the .7000 level. Would take break here to expose the .7094 high to retest but mixed daily studies suggest ranging action likely to extend. A later break will resume the April gains and see room for extension to strong resistance at .7158/.7210 area. Meanwhile, support remains at .6942 and this extend to the .6900 congestion, expected to underpin. Failure to hold this will open up room for deeper pullback to the .6850/.6800 congestion.