Published: 2026-03-02T00:52:44.000Z
Chart NZD/USD Update: Leaning lower in consolidation
1
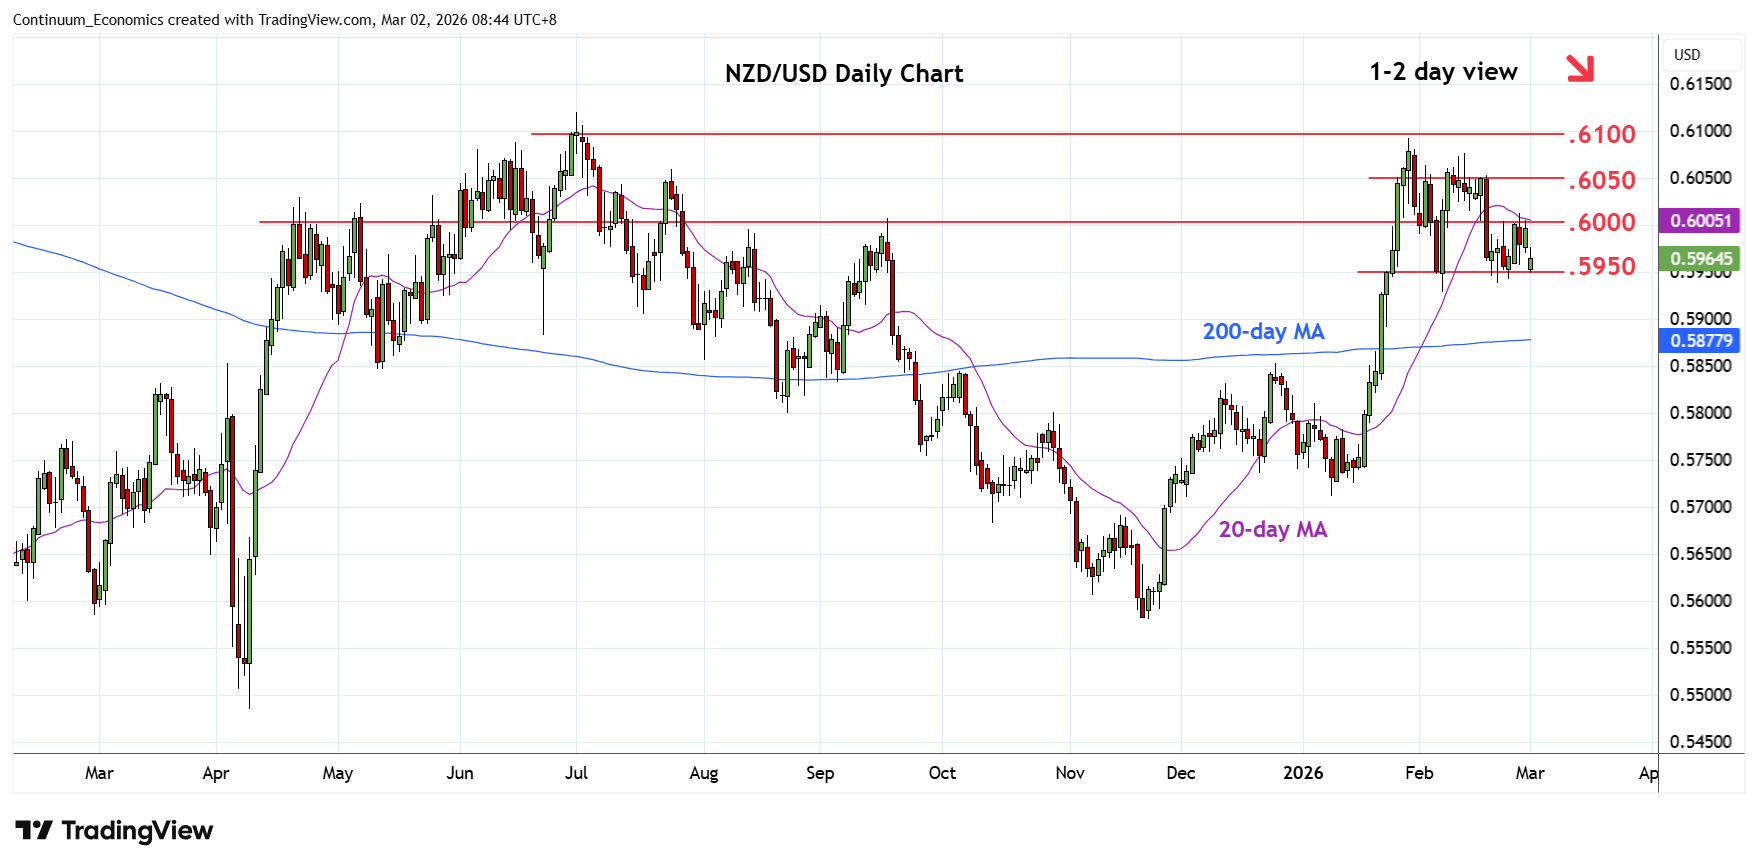
Leaning lower in consolidation as prices settled back from test of the .6000 level
| Levels | Imp | Comment | Levels | Imp | Comment | |||
|---|---|---|---|---|---|---|---|---|
| R4 | .6093 | ** | 29 Jan YTD high | S1 | .5950 | * | congestion, 38.2% | |
| R3 | .6076 | * | 12 Feb high | S2 | .5928 | ** | 6 Feb low | |
| R2 | .6050 | ** | congestion | S3 | .5900 | * | 50% Jan rally | |
| R1 | .6000 | * | figure, congestion | S4 | .5853/50 | ** | Dec high, congestion |
Asterisk denotes strength of level
00:45 GMT - Leaning lower in consolidation as prices settled back from test of the .6000 level. Daily and weekly studies have turned negative and threaten break of the .5950 support to open up room for deeper pullback to retrace the January rally. Lower will will room to the .5900, 50% Fibonacci level. Lower still will open up room to the strong support at the .5850 congestion. Meanwhile, resistance at the .6000 level is expected to cap. Clearance here ease the downside pressure and see room for extension to retest the .6050 congestion then the .6076/.6093 highs.