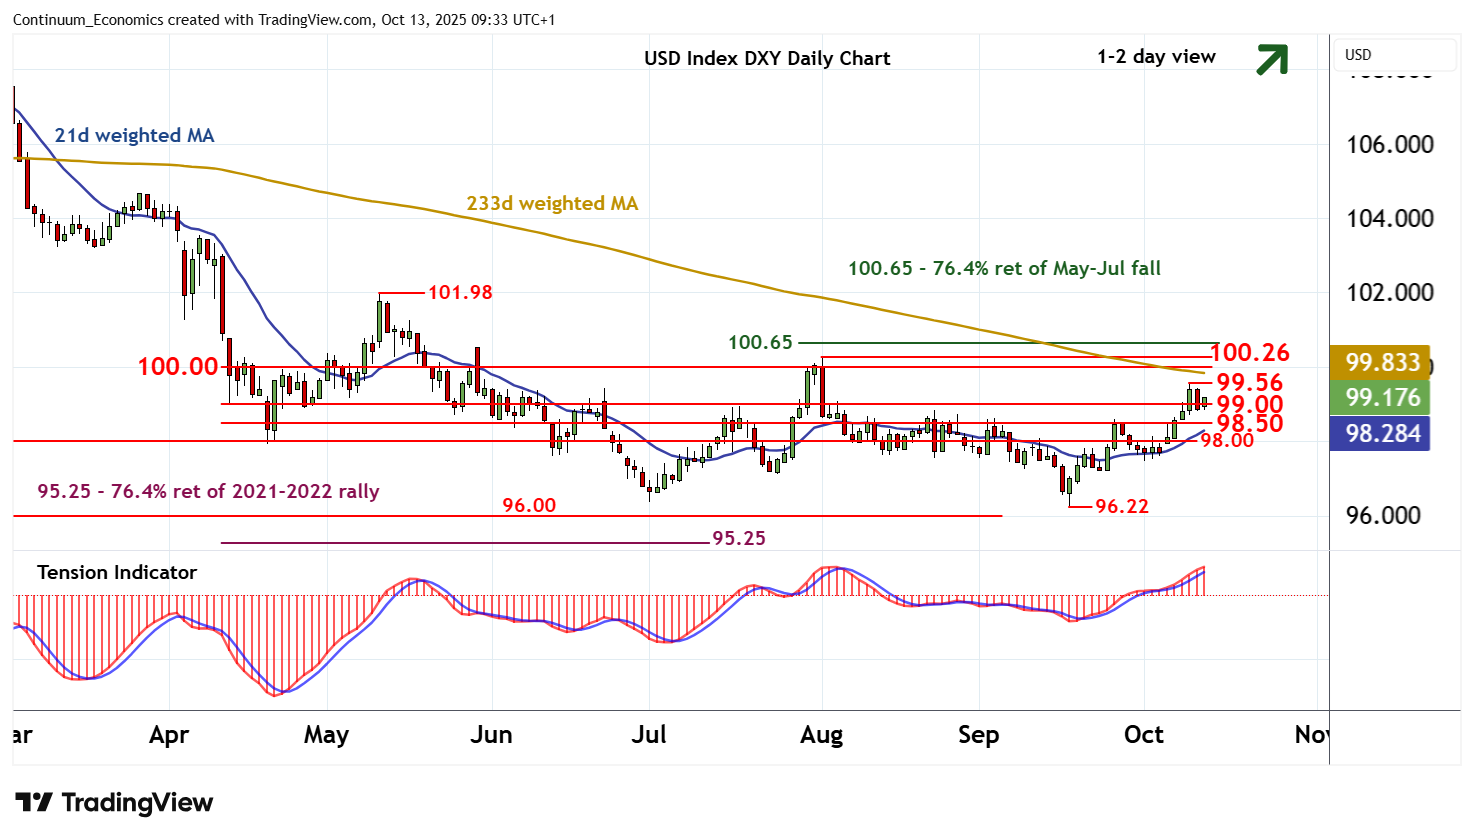
Chart USD Index DXY Update: Cautious trade - studies edging higher
The anticipated test of congestion support at 99.00 is giving way to consolidation
| Levels | Imp | Comment | Levels | Imp | Comment | |||
|---|---|---|---|---|---|---|---|---|
| R4 | 100.65 | ** | 76.4% ret of May-Jul fall | S1 | 99.00 | * | congestion | |
| R3 | 100.26 | ** | 1 Aug (m) high | S2 | 98.50 | congestion | ||
| R2 | 100.00 | ** | congestion | S3 | 98.00 | * | congestion | |
| R1 | 99.56 | * | 9 Oct (w) high | S4 | 97.50 | * | congestion |
Asterisk denotes strength of level
09:15 BST - The anticipated test of congestion support at 99.00 is giving way to consolidation, as oversold intraday studies unwind, with prices currently trading around 99.15. Focus is turning back to the 99.56 weekly high of 9 October. But unwinding overbought daily stochastics are expected to limit any initial tests in consolidation, before the rising daily Tension Indicator and positive weekly charts prompt a break. A close above here will open up strong resistance at congestion around 100.00 and the 100.26 monthly high of 1 August. Meanwhile, any tests below 99.00 should be limited in renewed buying interest above further congestion around 98.50.