Published: 2025-12-15T00:30:27.000Z
Chart NZD/USD Update: Lower in consolidation
1
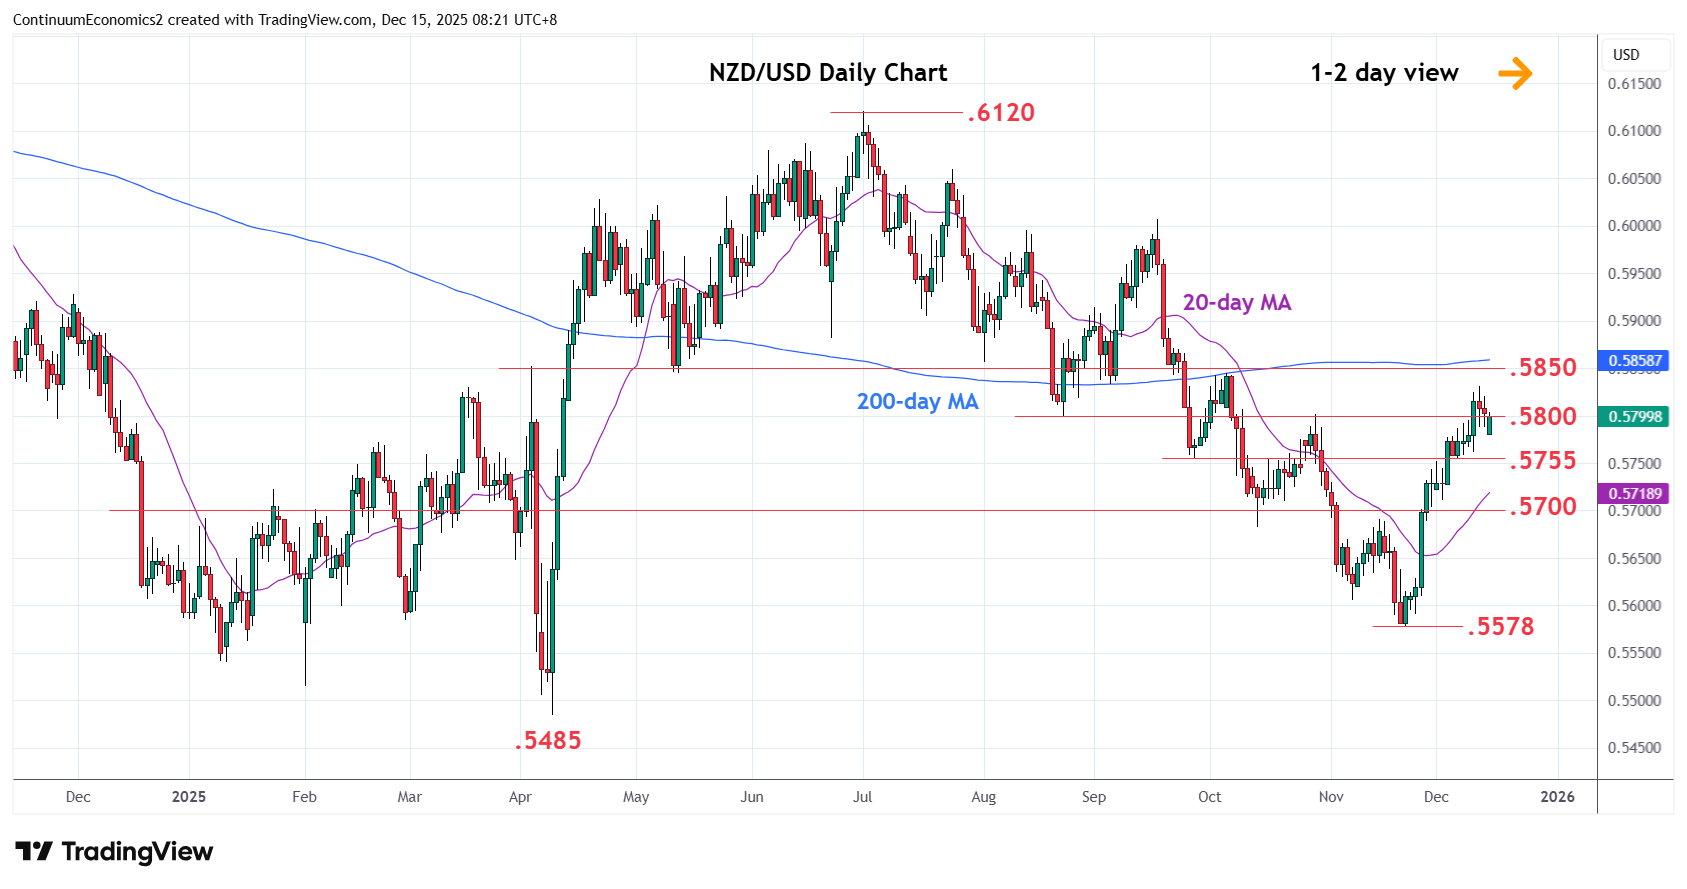
Leaning lower from the .5830 high as prices settled back in consolidation and unwind overbought daily studies
| Levels | Imp | Comment | Levels | Imp | Comment | |||
|---|---|---|---|---|---|---|---|---|
| R4 | .5950 | * | congestion | S1 | .5755/50 | * | Sep low, congestion | |
| R3 | .5910 | * | 61.8% Jul/Nov fall | S2 | .5700/.5682 | ** | congestion, Oct low | |
| R2 | .5850/55 | ** | 50%, 1 Aug low | S3 | .5650 | * | congestion | |
| R1 | .5830 | * | 11 Dec high | S4 | .5606 | 7 Nov low |
Asterisk denotes strength of level
00:25 GMT - Leaning lower from the .5830 high as prices settled back in consolidation and unwind overbought daily studies. Below the .5800 level see room for corrective pullback to support at .5755/50 congestion. Break here will open up room for deeper correction to .5700. However, corrective gains are expected to give way to renewed buying interest later. Above the .5830 high will see room to strong resistance at the .5850/55, 50% Fibonacci level and 1st August low. Break will see room for extension to the .5900 level and .5910, 61.8% Fibonacci level.