Published: 2024-12-11T16:51:07.000Z
Chart USD/CAD Update: Limited tests lower

Senior Technical Strategist
2

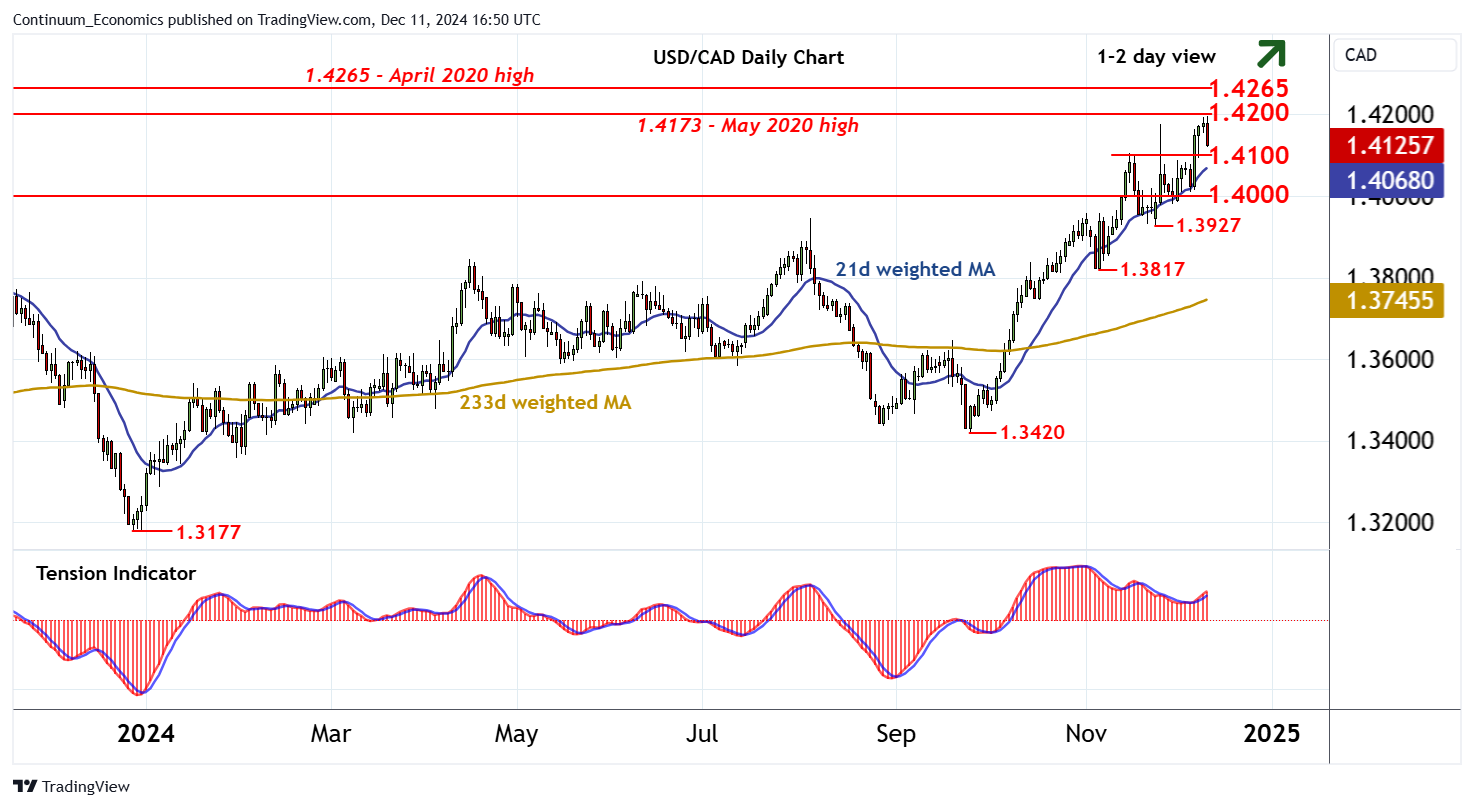
Consolidation beneath the 1.4200~ current year high is giving way to a pullback

| Levels | Imp | Comment | Levels | Imp | Comment | |||
|---|---|---|---|---|---|---|---|---|
| R4 | 1.4400 | figure | S1 | 1.4100 | * | break level | ||
| R3 | 1.4298 | ** | April 2020 high | S2 | 1.4000 | * | congestion | |
| R2 | 1.4265 | * | late-Apr 2020 (w) high | S3 | 1.3958 | * | 1-6 Nov (w) high | |
| R1 | 1.4200 | current year high | S4 | 1.3927 | * | 25 Nov (w) low |
Asterisk denotes strength of level
16:30 GMT - Consolidation beneath the 1.4200~ current year high is giving way to a pullback, as intraday studies turn down, with sharp selling interest putting focus on support at the 1.4100 break level. Overbought daily stochastics are also turning down, highlighting room for a break beneath here. But the rising daily Tension Indicator and improving weekly charts should limit scope in renewed buying interest above congestion around 1.4000. Following corrective trade, fresh gains are looked for. But a close above 1.4200 is needed to confirm continuation of June 2021 gains towards the 1.4265/68 highs from April 2020.