Chart AUD/USD Update: Sharp pullback from fresh 2026 year highs
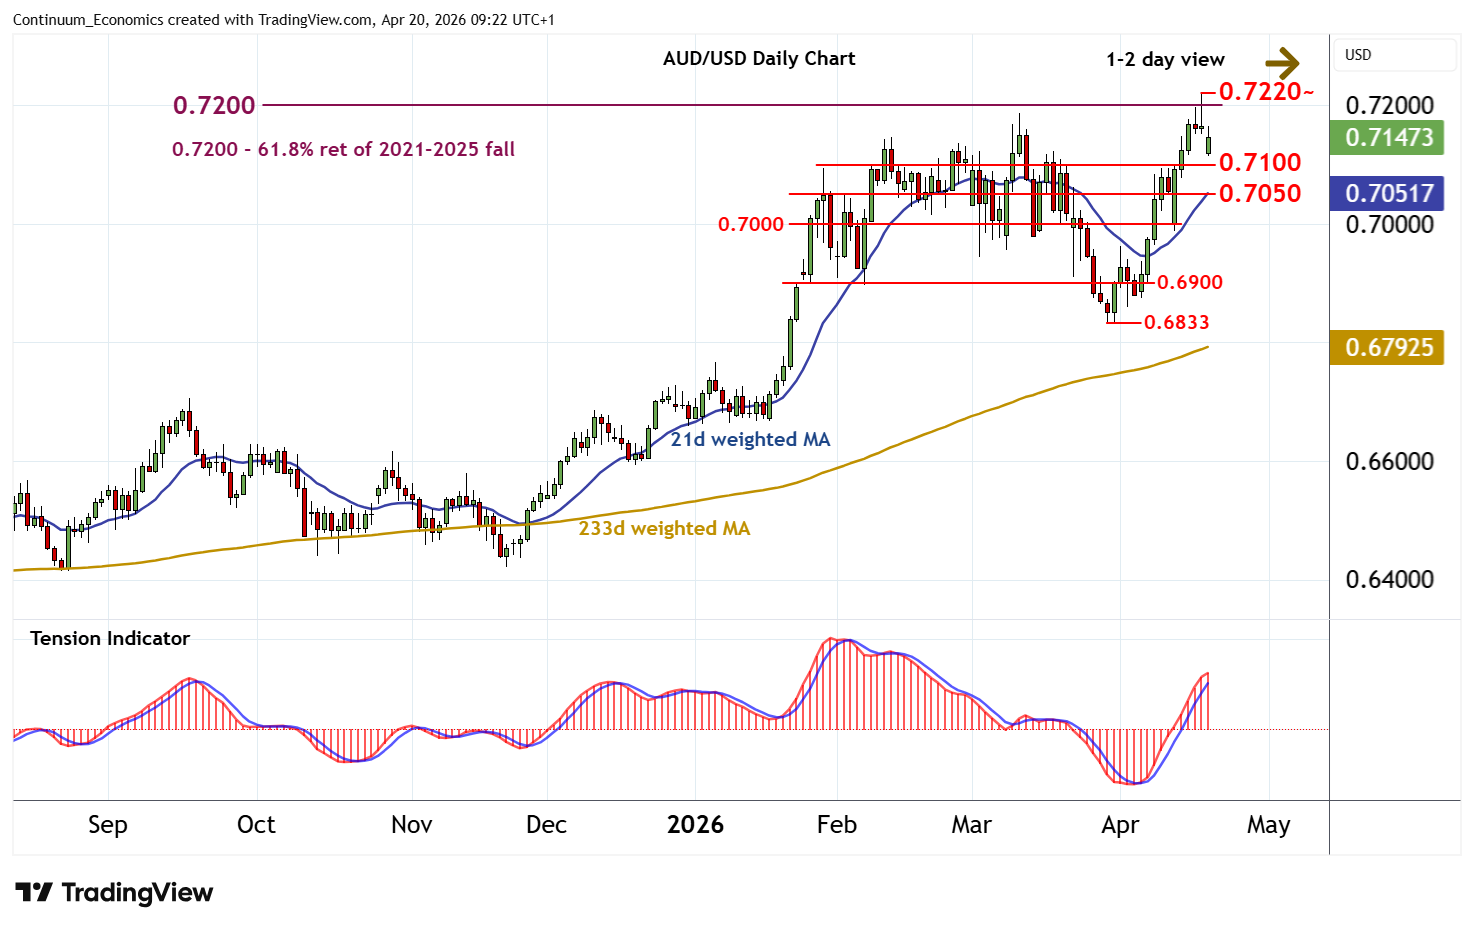
The break above resistance at the 0.7200 Fibonacci retracement to fresh 2026 year highs around 0.7220~ has been met by strong selling interest
| Levels | Imp | Comment | Levels | Imp | Comment | |||
|---|---|---|---|---|---|---|---|---|
| R4 | 0.7400 | ** | historic congestion | S1 | 0.7100 | congestion | ||
| R3 | 0.7280~ | ** | June 2022 high | S2 | 0.7050 | * | congestion | |
| R2 | 0.7220~ | * | 17 Apr YTD high | S3 | 0.7000 | * | congestion | |
| R1 | 0.7200 | ** | 61.8% ret of 2021-2025 fall | S4 | 0.6960 | * | 1 Apr (w) high |
Asterisk denotes strength of level
09:10 BST - The break above resistance at the 0.7200 Fibonacci retracement to fresh 2026 year highs around 0.7220~ has been met by strong selling interest, with prices falling sharply to 0.7115 before consolidating around 0.7145. Overbought daily stochastics are turning down and the positive daily Tension Indicator is flattening, suggesting room for a test of congestion support at 0.7100. But rising weekly readings should limit any deeper losses in renewed buying interest above further congestion around 0.7050. Meanwhile, a close above 0.7200/20~, not yet seen, will turn sentiment positive once again and extend April 2025 gains towards the 0.7280~ high of June 2022.