Chart USD/CAD Update: Choppy above 1.4270/00 - studies under pressure

The test of support at the 1.4270 Fibonacci retracement and congestion lows around 1.4300 has given way to a gap higher to 1.4375
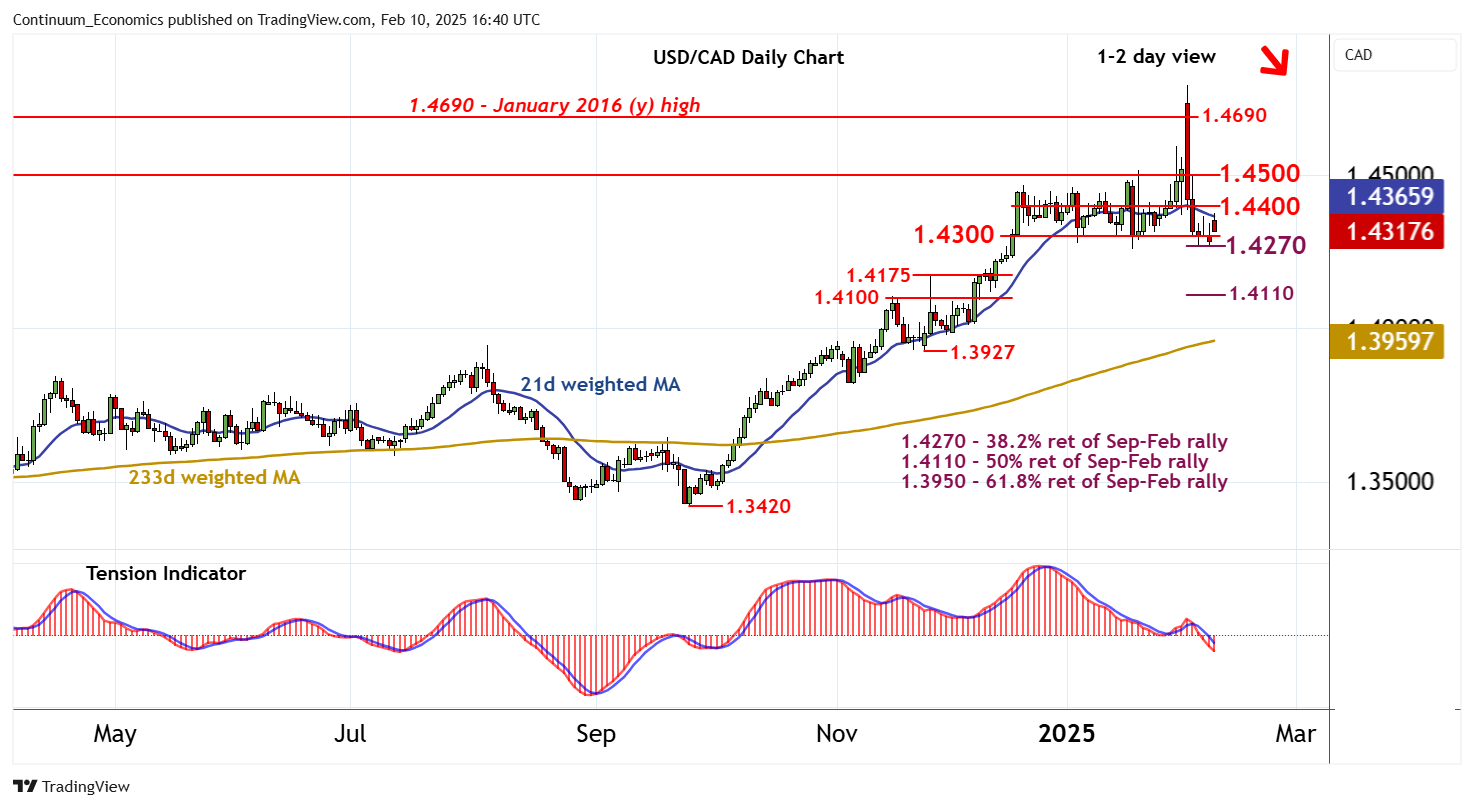
| Levels | Imp | Comment | Levels | Imp | Comment | |||
|---|---|---|---|---|---|---|---|---|
| R4 | 1.4790~ | ** | 3 Feb YTD high | S1 | 1.4300 | * | congestion lows | |
| R3 | 1.4690 | ** | January 2016 (y) high | S2 | 1.4270 | * | 38.2% ret of Sep-Feb rally | |
| R2 | 1.4500 | ** | congestion | S3 | 1.4175 | break level | ||
| R1 | 1.4400 | break level | S4 | 1.4100/10 | ** | congestion; 50% ret |
Asterisk denotes strength of level
16:25 GMT - The test of support at the 1.4270 Fibonacci retracement and congestion lows around 1.4300 has given way to a gap higher to 1.4375, where unwinding overbought intraday studies are prompting a steady pullback towards 1.4300. Oversold daily stochastics are ticking higher, suggesting potential for consolidation above 1.4270/00. But the daily Tension Indicator is bearish and broader weekly charts are under pressure, highlighting a room for further losses in the coming sessions. A later close beneath here will add weight to already bearish price action and extend February losses towards the 1.4175 break level. Still lower is 1.4100/10, but already oversold daily stochastics could limit any initial tests in short-covering/consolidation. Meanwhile, resistance remains at 1.4400. Any tests above here are expected to meet fresh selling interest beneath congestion around 1.4500.