Chart USD/CAD Update: Balanced above 1.3800 - studies under pressure
Little change, as mixed/negative intraday studies and rising oversold daily stochastics keep near-term sentiment cautious
| Levels | Imp | Comment | Levels | Imp | Comment | |||
|---|---|---|---|---|---|---|---|---|
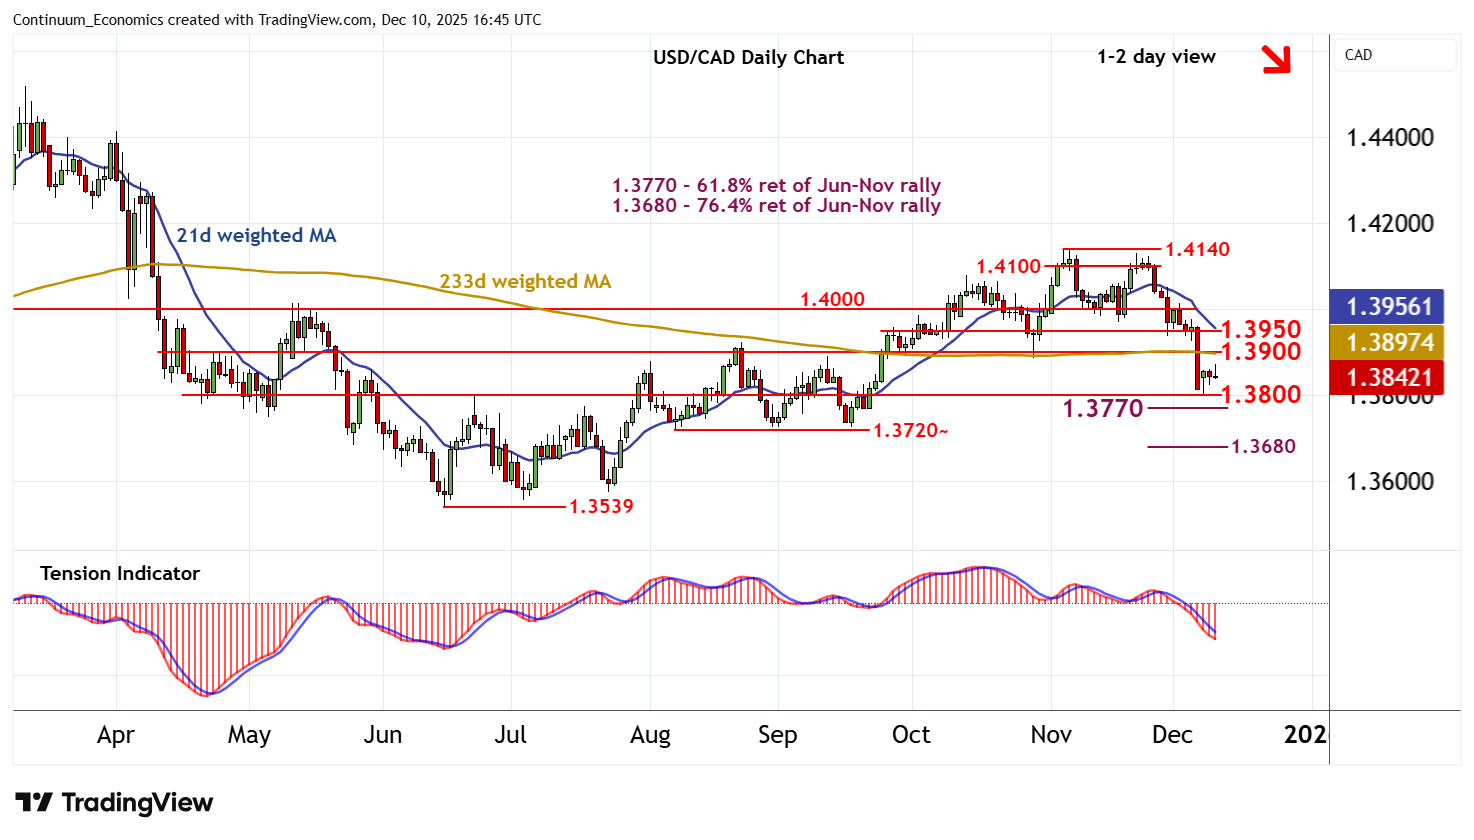
| R4 | 1.4100 | * | break level | S1 | 1.3800 | ** | congestion | |
| R3 | 1.4000 | * | break level | S2 | 1.3770 | ** | 61.8% ret of Jun-Nov rally | |
| R2 | 1.3950 | * | break level | S3 | 1.3720~ | ** | Aug-Sep lows | |
| R1 | 1.3900 | ** | break level | S4 | 1.3680 | ** | 76.4% ret of Jun-Nov rally |
Asterisk denotes strength of level
16:35 GMT - Little change, as mixed/negative intraday studies and rising oversold daily stochastics keep near-term sentiment cautious, and extend consolidation around 1.3835. The daily Tension Indicator continues to track lower and broader weekly charts are bearish, highlighting room for further losses in the coming sessions. A later break below congestion support at 1.3800 will open up the 1.3770 Fibonacci retracement, where fresh consolidation could develop, before November losses extend still further. Meanwhile, a close above resistance at the 1.3900 break level, if seen, will help to stabilise price action and prompt consolidation beneath 1.3950.