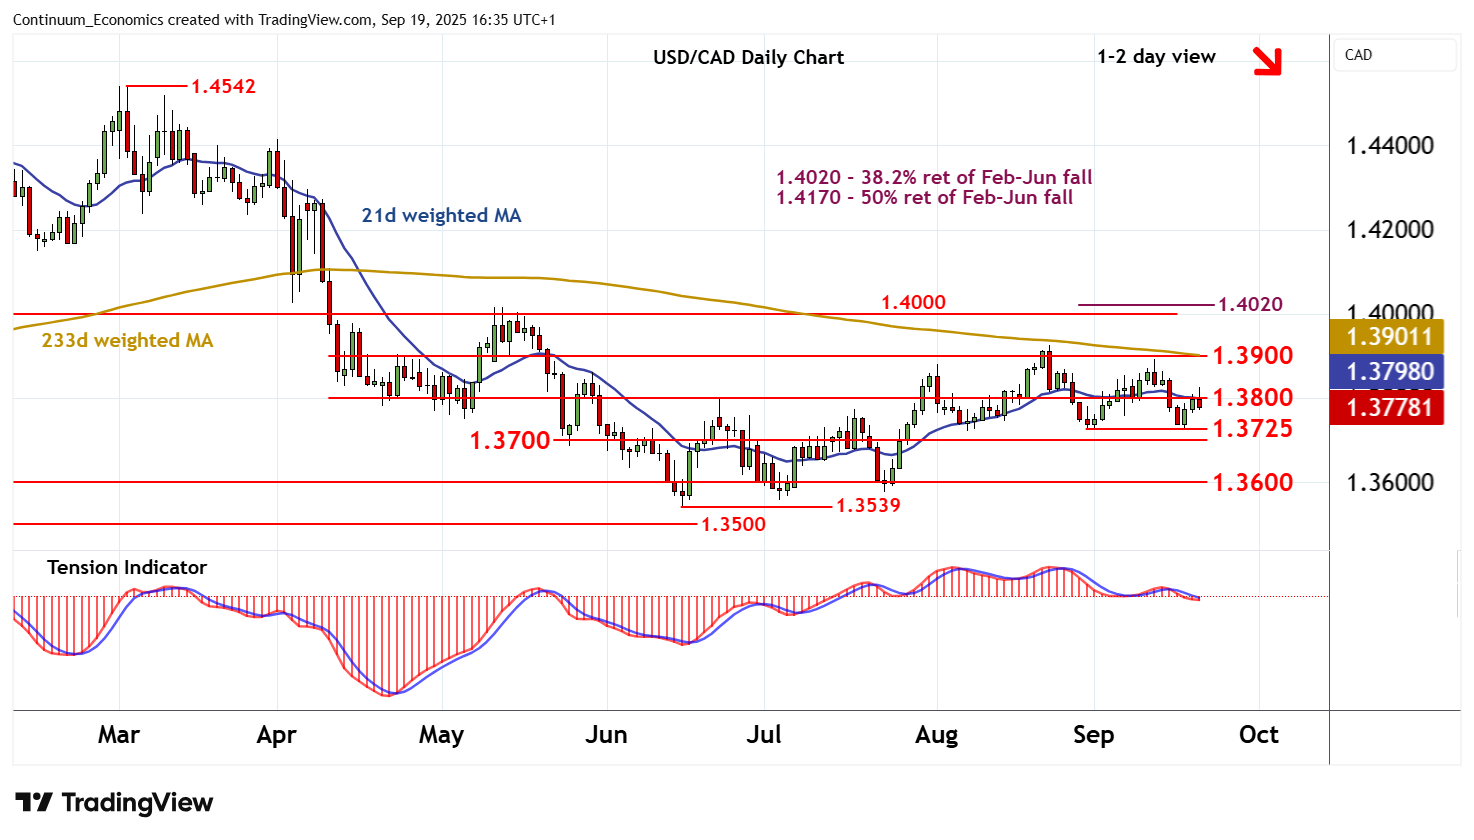
Chart USD/CAD Update: Leaning lower in CAD-driven trade
The anticipated break above congestion resistance at 1.3800 has been pushed back sharply from 1.3825 in CAD-driven trade

| Levels | Imp | Comment | Levels | Imp | Comment | |||
|---|---|---|---|---|---|---|---|---|
| R4 | 1.4170 | ** | 50% ret of Feb-Jun fall | S1 | 1.3725 | * | 29 Aug (w) low | |
| R3 | 1.4000/20 | ** | break level; 38.2% ret | S2 | 1.3700 | ** | congestion | |
| R2 | 1.3900 | ** | break level | S3 | 1.3600 | ** | congestion | |
| R1 | 1.3800 | * | congestion | S4 | 1.3539 | ** | 16 Jun YTD low |
Asterisk denotes strength of level
16:20 BST - The anticipated break above congestion resistance at 1.3800 has been pushed back sharply from 1.3825 in CAD-driven trade, with prices currently trading around 1.3775. Overbought intraday studies are turning down, unwinding negative divergence, suggesting room for further losses. But rising daily readings and mixed weekly charts are expected to limit initial scope in renewed consolidation above the 1.3725 weekly low of 29 August. A close beneath here, however, will turn sentiment negative and extend late-August losses below 1.3700 towards 1.3600. Meanwhile, resistance remains up to 1.3900 and should cap any immediate tests back above 1.3800.