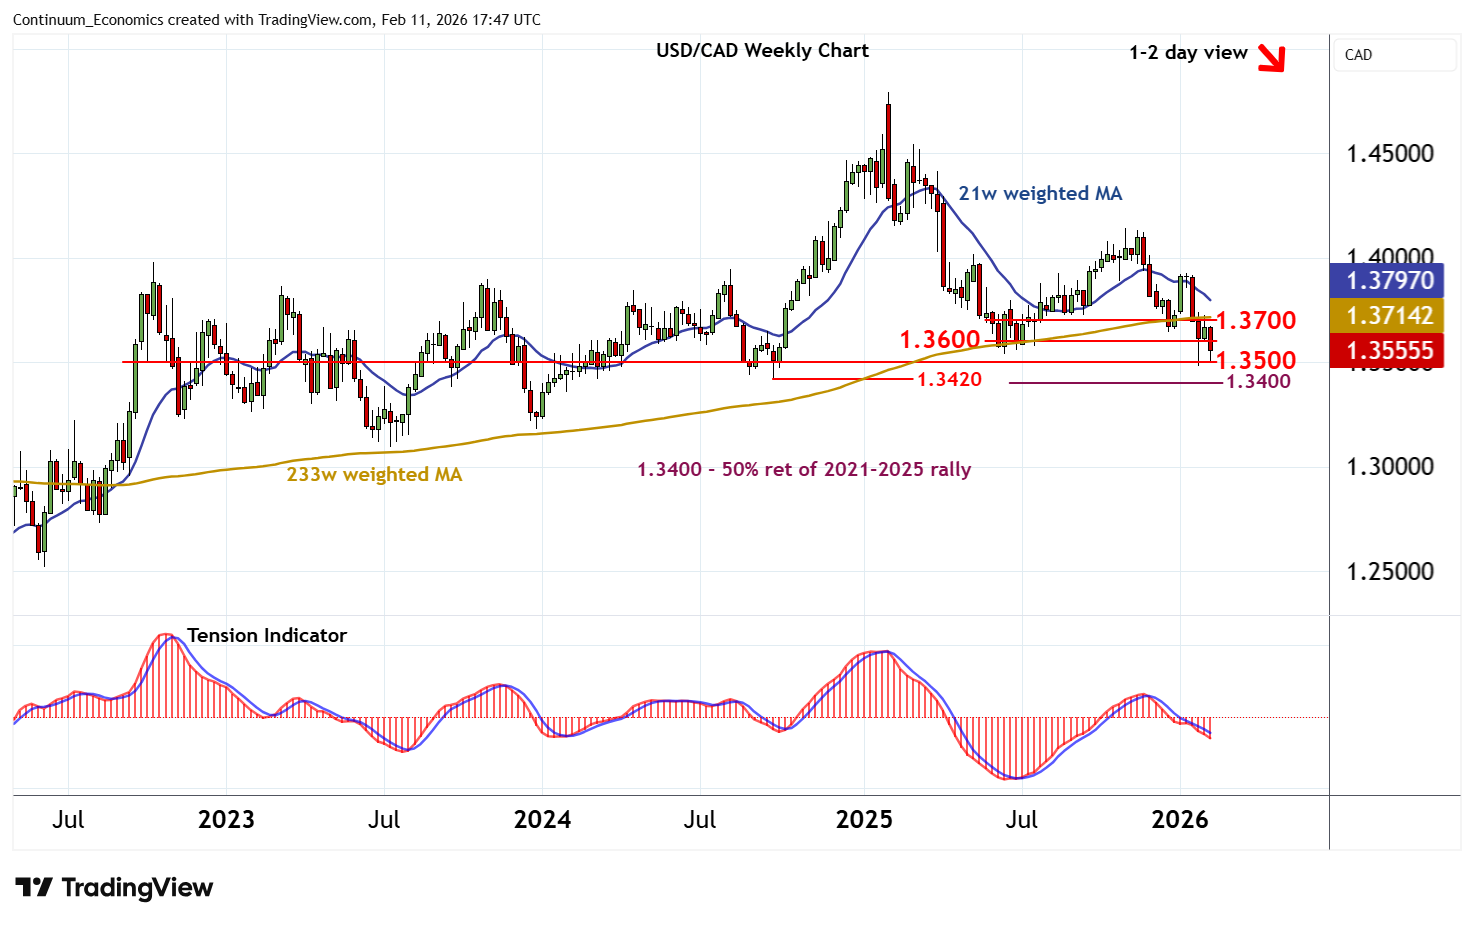
Chart USD/CAD Update: Choppy trade - background under pressure
The anticipated test of congestion support at 1.3500 has given way to choppy USD-driven trade within 1.3500 - 1.3600
| Levels | Imp | Comment | Levels | Imp | Comment | |||
|---|---|---|---|---|---|---|---|---|
| R4 | 1.3850 | congestion | S1 | 1.3500 | ** | congestion | ||
| R3 | 1.3800 | ** | congestion | S2 | 1.3480~ | ** | 30 Jan YTD low | |
| R2 | 1.3700 | * | congestion | S3 | 1.3420 | ** | September 2024 low | |
| R1 | 1.3600 | * | congestion | S4 | 1.3400/05 | ** | congestion; 50% ret |
Asterisk denotes strength of level
17:00 GMT - The anticipated test of congestion support at 1.3500 has given way to choppy USD-driven trade within 1.3500 - 1.3600, with prices currently balanced around 1.3550. Rising intraday studies highlight potential for a retest above congestion resistance at 1.3600. But mixed/negative daily readings and bearish weekly charts should limit scope in renewed selling interest beneath further congestion around 1.3700. Following cautious/choppy trade, fresh losses are looked for. A close below the 1.3480~ current year low of 30 January will add weight to sentiment and extend February 2025 losses below the 1.3480~ current year low of 30 January towards the 1.3420 low of September 2024.