Published: 2025-11-21T14:24:13.000Z
Chart USD/JPY Update: Limited downside tests
2
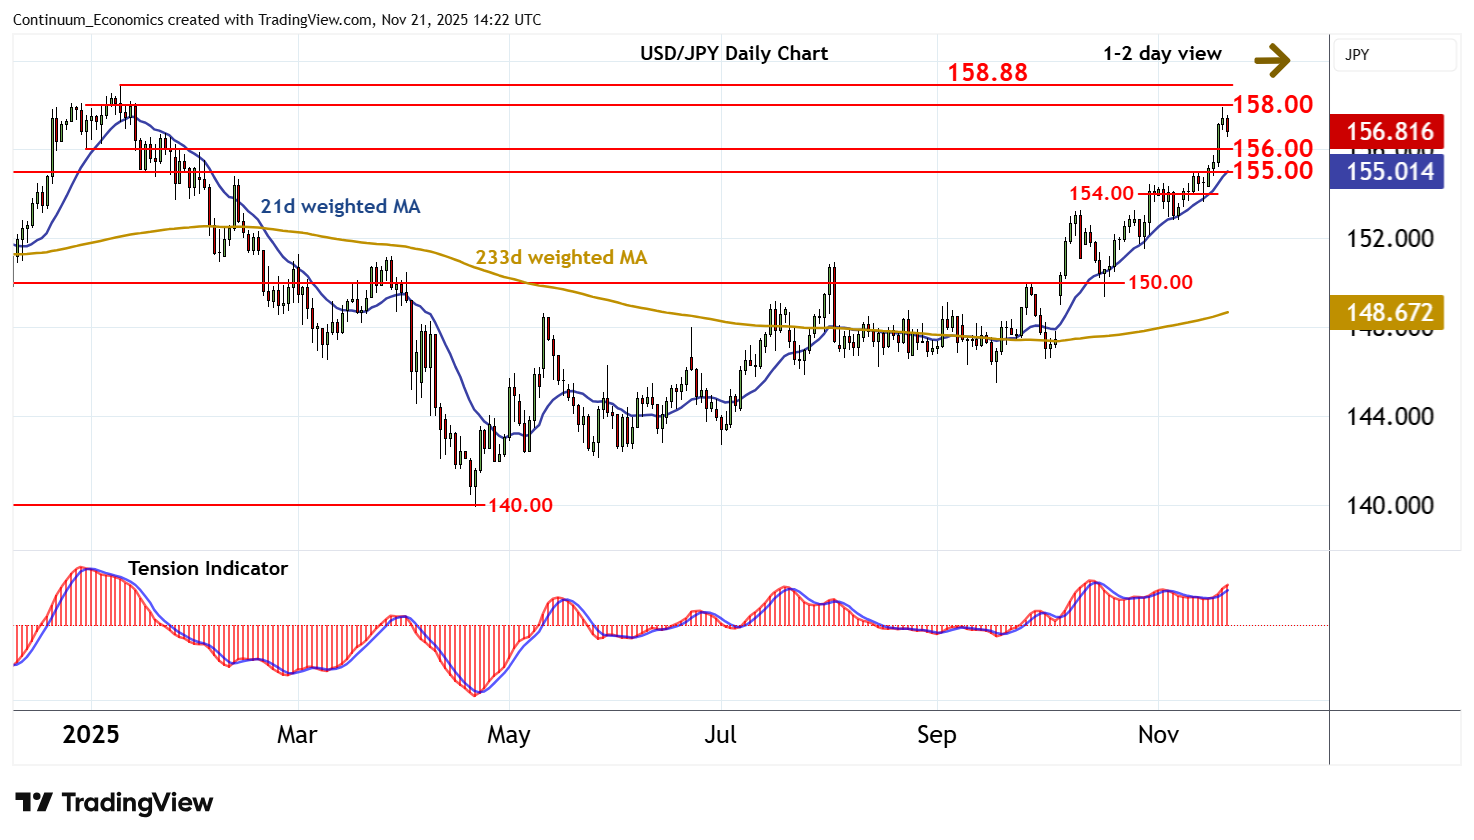
Cautious trade beneath resistance at 158.00 is giving way to a JPY-driven drift lower
| Levels | Imp | Comment | Levels | Imp | Comment | |||
|---|---|---|---|---|---|---|---|---|
| R4 | 161.95 | ** | Jul 2024 | S1 | 156.00 | * | congestion | |
| R3 | 160.00 | ** | congestion | S2 | 155.00 | * | break level | |
| R2 | 158.88 | ** | 10 Jan YTD high | S3 | 154.00 | * | break level | |
| R1 | 157.90/00 | * | 20 Nov high; break level | S4 | 153.00 | * | congestion |
Asterisk denotes strength of level
14:00 GMT - Cautious trade beneath resistance at 158.00 is giving way to a JPY-driven drift lower, with prices currently trading around 156.90. Overbought daily stochastics are also turning down, highlighting room for further profit-taking. But the positive daily Tension Indicator and mixed/positive weekly charts are expected to limit scope in renewed buying interest towards congestion support at 156.00. Following cautious trade, fresh gains are looked for. Resistance is up to the 158.88 current year high of 10 January. A close above here would extend September 2024 gains towards historic congestion around 160.00.