Chart GBP/USD Update: Extending January gains

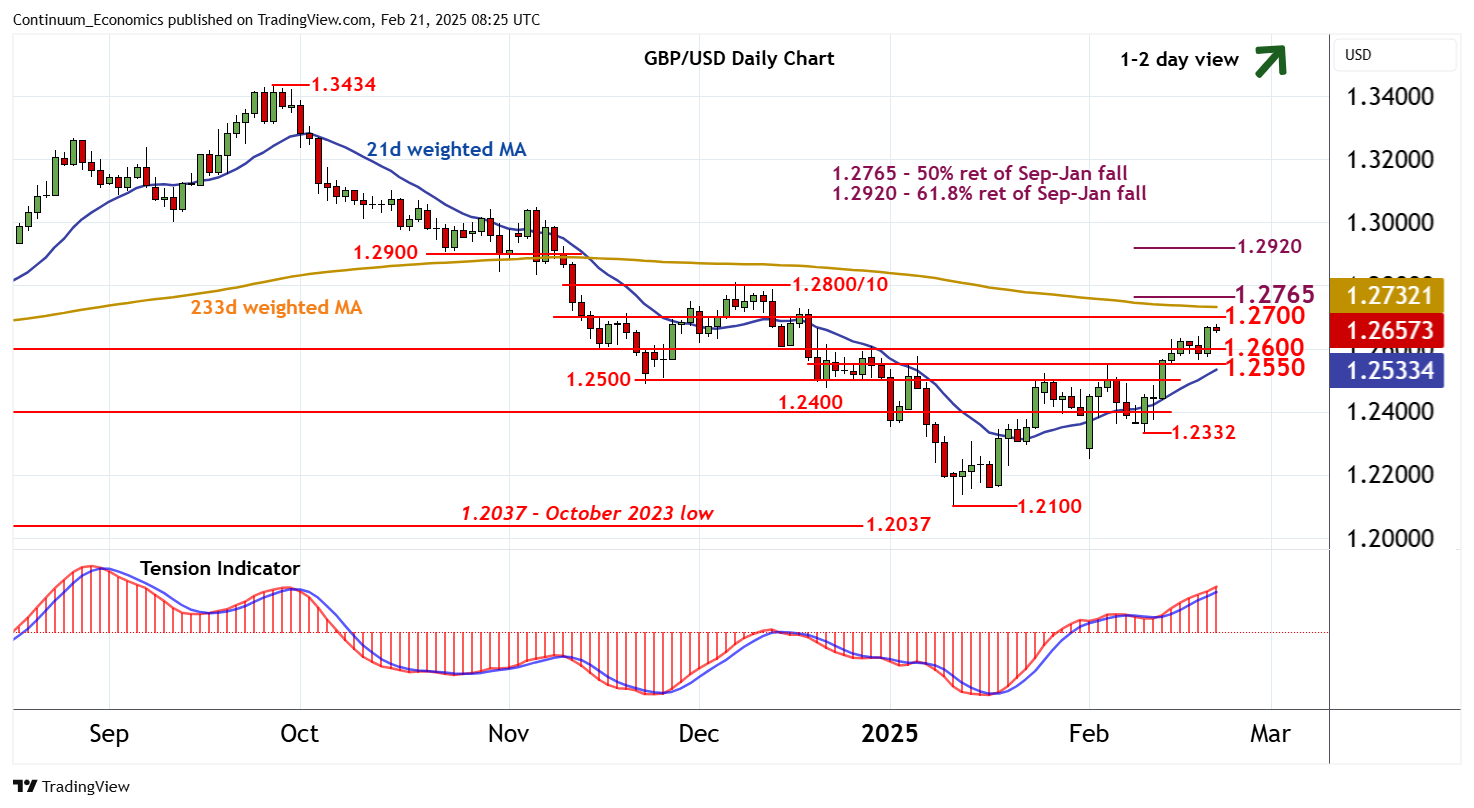
Consolidation around 1.2600 has given way to a break higher
| Level | Comment | Level | Comment | |||||
|---|---|---|---|---|---|---|---|---|
| R4 | 1.2900 | * | break level | S1 | 1.2600 | * | congestion | |
| R3 | 1.2800/10 | ** | congestion; 6 Dec (m) high | S2 | 1.2550 | * | break level | |
| R2 | 1.2765 | ** | 50% ret of Sep-Jan fall | S3 | 1.2500 | * | break level | |
| R1 | 1.2700 | * | congestion | S4 | 1.2450 | break level |
Asterisk denotes strength of level
08:10 GMT - Consolidation around 1.2600 has given way to a break higher, with prices reaching 1.2680 before settling into consolidation. Overbought intraday studies are unwinding and overbought daily stochastics are flattening, suggesting further sideways trade, before the positive daily Tension Indicator and rising weekly charts prompt further gains. A later break above congestion around 1.2700 will extend January gains towards the 1.2765 Fibonacci retracement. But profit-taking pressure is expected to increase towards here and limit any initial tests in fresh consolidation. Meanwhile, support is raised to 1.2600 and should underpin any immediate setbacks.