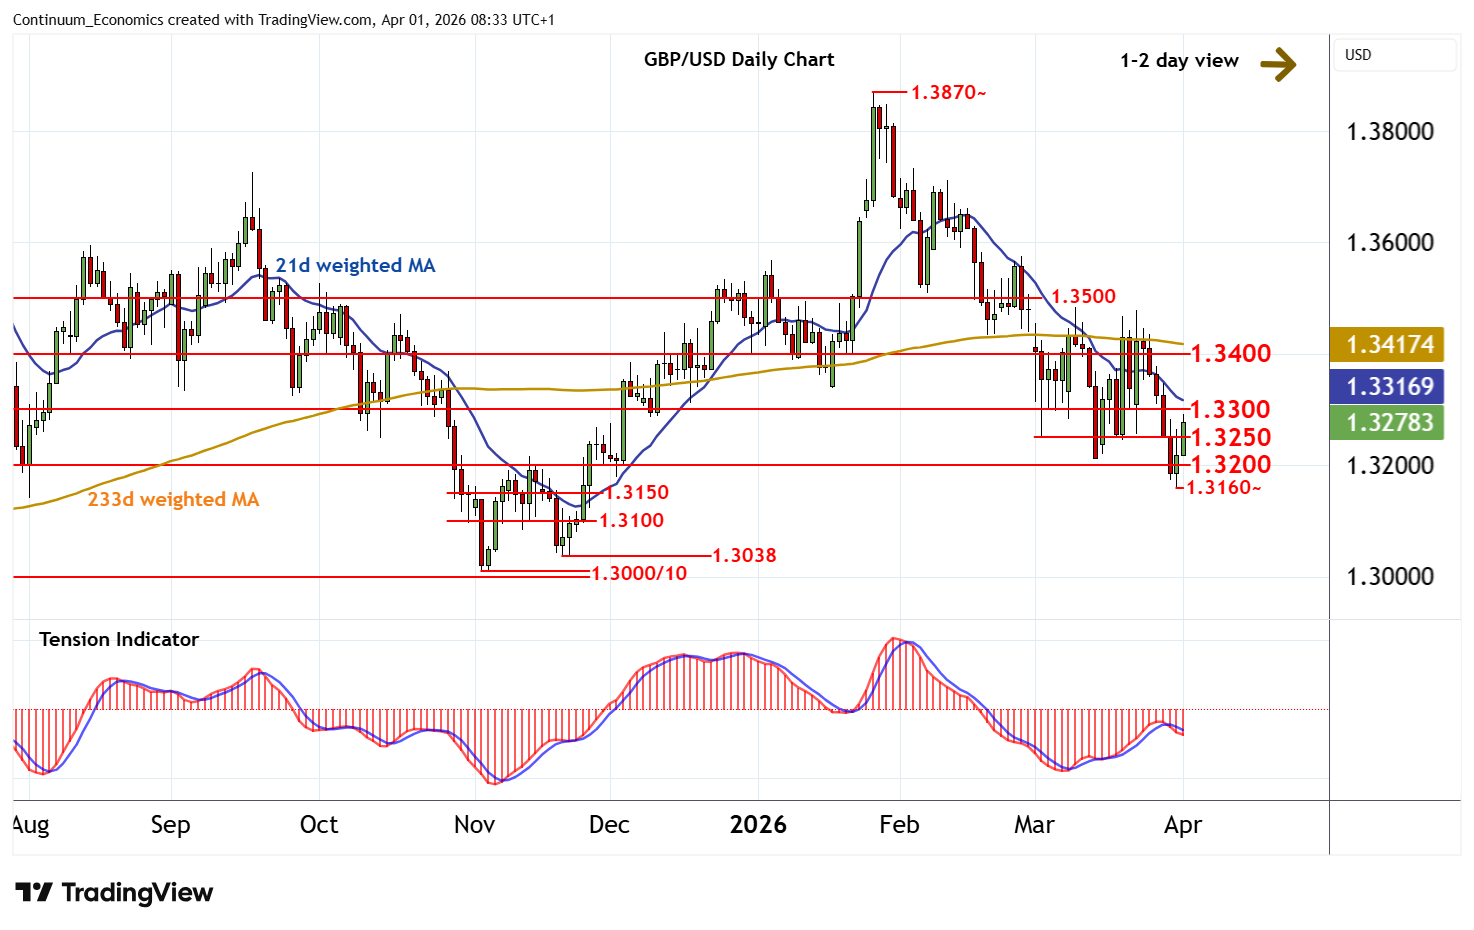
Chart GBP/USD Update: Short-covering from current year low
Choppy trade around 1.3200 has given way to short-covering and a sharp bounce
| Level | Comment | Level | Comment | |||||
|---|---|---|---|---|---|---|---|---|
| R4 | 1.3500 | ** | congestion | S1 | 1.3250 | * | congestion | |
| R3 | 1.3480/85~ | * | 10-23 Mar (w) high | S2 | 1.3200 | * | congestion | |
| R2 | 1.3400 | ** | congestion | S3 | 1.3160~ | * | 31 Mar YTD low | |
| R1 | 1.3300 | * | congestion | S4 | 1.3150 | * | congestion |
Asterisk denotes strength of level
08:10 BST - Choppy trade around 1.3200 has given way to short-covering and a sharp bounce, with focus turning to congestion resistance at 1.3300. Intraday studies are rising and negative daily readings are flattening, suggesting room for a break above here. But mixed/negative weekly charts should limit initial scope in consolidation beneath further congestion around 1.3400. Meanwhile, support is raised to congestion around 1.3250 and extends to 1.3200. But a close below the 1.3160~ current year low of 31 March is needed to turn sentiment negative and confirm continuation of late-January losses, initially into congestion within the 1.3100/50 range.