Published: 2026-03-02T09:19:46.000Z
Chart USD Index DXY Update: Extending January gains
2
Cautious trade has given way to a sharp break higher
| Levels | Imp | Comment | Levels | Imp | Comment | |||
|---|---|---|---|---|---|---|---|---|
| R4 | 99.50 | ** | 15 Jan (m) high, cong | S1 | 98.00 | * | congestion | |
| R3 | 99.25 | ** | 76.4% ret of Nov-Jan fall | S2 | 97.50 | ** | congestion | |
| R2 | 99.00 | ** | congestion | S3 | 97.00 | * | congestion | |
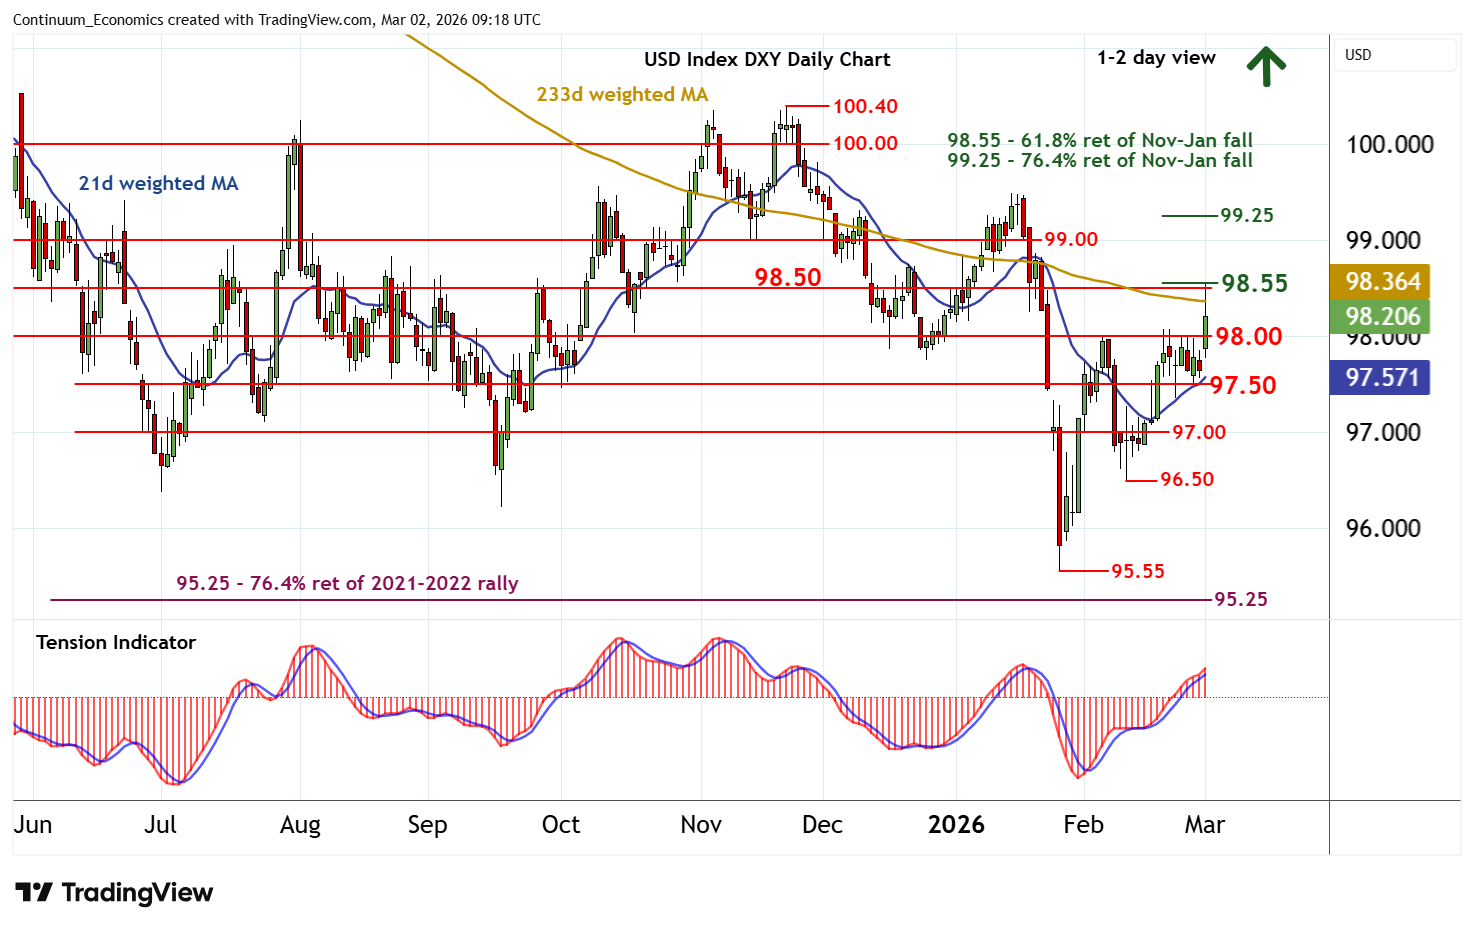
| R1 | 98.50/55 | * | congestion; 61.8% ret | S4 | 96.50 | * | 11 Feb (w) low |
Asterisk denotes strength of level
09:10 GMT - Cautious trade has given way to a sharp break higher, with prices reaching strong resistance at congestion around 98.50 and the 98.55 Fibonacci retracement. A pullback is unfolding, with prices currently trading around 98.25. But daily readings have turned positive and broader weekly charts are improving, highlighting room for further strength in the coming sessions. A close above 98.50/55 will further improve sentiment and extend late-January gains towards congestion around 99.00. Just higher is the 99.25 retracement. But already overbought daily stochastics should limit any tests of this 99.00/25 range in profit-taking/consolidation.