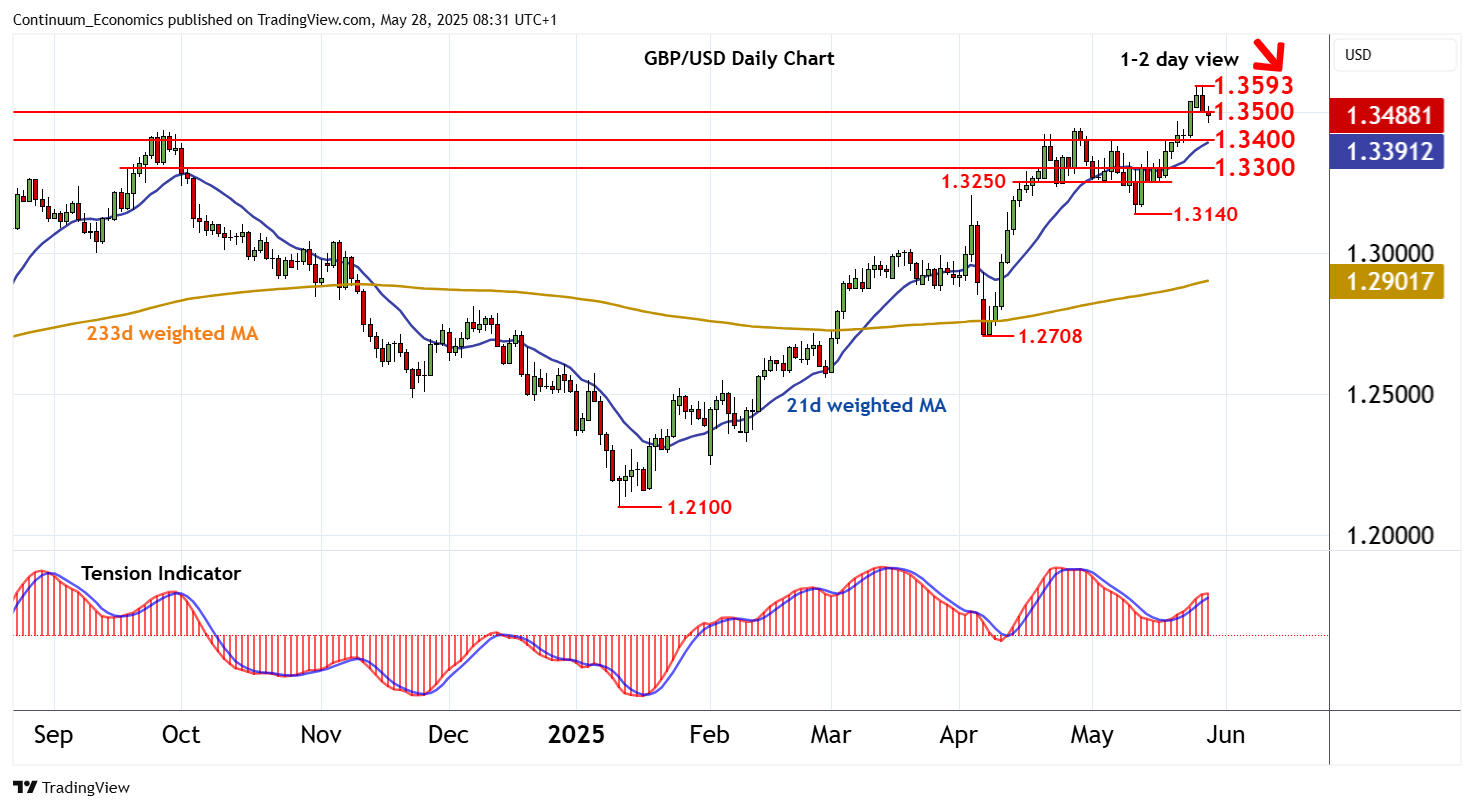
Chart GBP/USD Update: Turning away from current 2025 year high

Consolidation beneath resistance at the 1.3593 current year high of 26 May is giving way to a pullback
| Level | Comment | Level | Comment | |||||
|---|---|---|---|---|---|---|---|---|
| R4 | 1.3750~ | ** | January 2022 (y) high | S1 | 1.3400 | congestion | ||
| R3 | 1.3650 | * | congestion | S2 | 1.3300 | break level | ||
| R2 | 1.3593/00 | ** | 26 May YTD high; cong | S3 | 1.3250~ | * | range lows | |
| R1 | 1.3500 | ** | congestion | S4 | 1.3140 | ** | 12 May low |
Asterisk denotes strength of level
08:10 BST - Consolidation beneath resistance at the 1.3593 current year high of 26 May is giving way to a pullback, as intraday studies turn down, with prices currently trading just below 1.3500. Overbought daily stochastics are also turning down and the positive daily Tension Indicator is flattening, highlighting room for continuation down to congestion support at 1.3400. But mixed weekly charts should limit any initial tests in renewed consolidation. Meanwhile, a close back above 1.3500 will help to stabilise price action. But a further close above 1.3593/00 is needed to turn price action positive and confirm continuation of broad January 2025 gains beyond congestion around 1.3650 towards the 1.3750~ year high of January 2022.