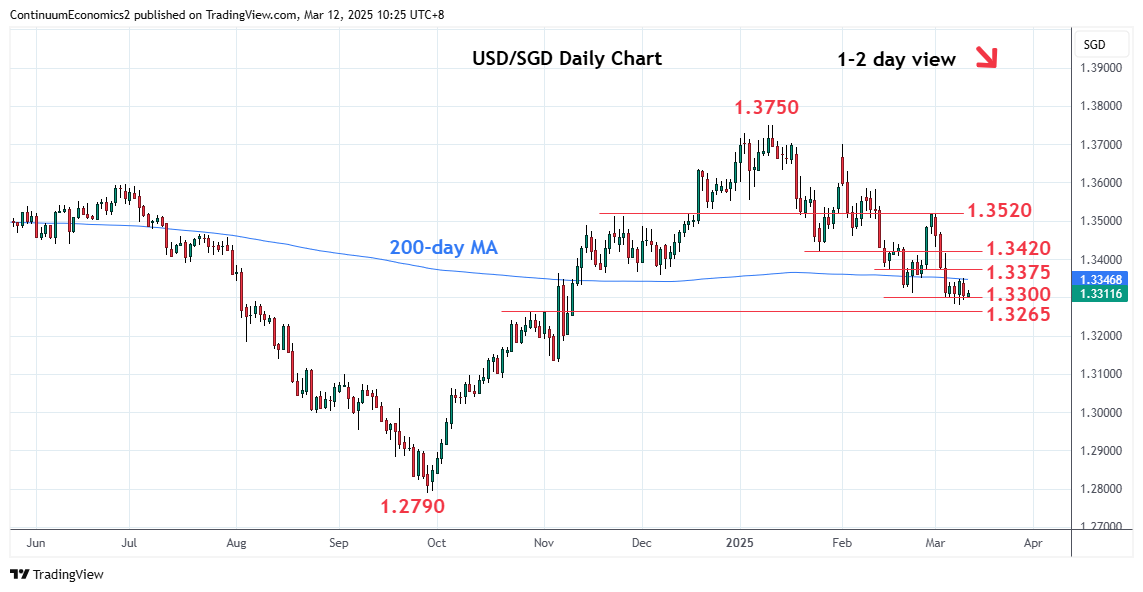
No follow-through on break of the 1.3300 level as prices consolidate sharp losses from the 1.3520 high of last week

| Level | Comment | Level | Comment | ||||
|---|---|---|---|---|---|---|---|
| R4 | 1.3500/20 | ** | congestion, 28 Feb high | S1 | 1.3300 | * | congestion |
| R3 | 1.3460 | * | 5 Feb low | S2 | 1.3270/65 | ** | 50% Sep/Jan rally, Oct high |
| R2 | 1.3420 | ** | Jan low | S3 | 1.3200 | * | congestion |
| R1 | 1.3350/75 | * | 26, 17 Feb lows | S4 | 1.3155 | * | 61.8% Sep/Jan rally |
Asterisk denotes strength of level
02:30 GMT - No follow-through on break of the 1.3300 level as prices consolidate sharp losses from the 1.3520 high of last week. However, bearish structure from the January high keeps pressure on the downside and see scope for test of strong support at the 1.3270/65, 50% Fibonacci level and October high. Break here will extend the January losses and see extension to 1.3200 congestion and 1.3155, 61.8% Fibonacci level. Intraday and daily studies remain oversold but bounce likely to prove limited with resistance starting at the 1.3350/75 recent lows. Above here, will open up room for stronger bounce to the 1.3400/20 area.