China and EM Asia Outlook: Divergent Trends
· China’s growth momentum is being sustained by AI/tech and green energy production and investment. However, growth is imbalanced with modest consumption growth, due to adverse housing wealth effects and slow wage/job growth. Overall, we forecast 4.4% for 2026 and 4.2% for 2027. China’s fiscal policy easing will likely remain modest, as policymakers are constrained by the rapid debt build-up since 2007. In terms of monetary policy, the authorities’ actions continue to be restrained by concerns that too low interest rates could hurt China’s banking system interest margins and lending. This now argues against any reduction in the seven-day reverse repo rate in 2026 from 1.4%.
· India's GDP growth is forecast to slow to 6.2% y/y in FY2026/27 (from 7.7% in FY2025/26) as weaker private consumption, elevated food and fuel prices, monsoon-related risks and subdued private investment weigh on demand; headline inflation is expected to average 5.3%, prompting the RBI to maintain its inflation-focused stance and raise the policy rate by 25bps to 5.50%, where it is likely to remain through FY2027/28.
· Indonesia's economy is forecast to grow by 4.6% y/y in 2026, below official expectations, as weakening household demand, a depreciating rupiah, fading export momentum and El Niño-related risks weigh on activity; inflation is expected to average 3.6%, prompting Bank Indonesia (BI) to prioritise currency and price stability over growth, maintaining a tight policy stance with rates at 5.75%, while rising fiscal pressures and investor concerns over expanding state intervention add to downside risks.
Risks to the Outlook. The lagged adverse economic effects of the March-June spike in energy prices could be larger than expected, creating low growth and higher inflation than expected. This would also provide a dilemma for central banks. We would not see major 2nd round inflation effects however, given excess production and labor market slack. A China invasion of Taiwan/blockade is very high impact, but we still only attach a 5% probability in 2026 and 10% in 2027 to such a high risk Taiwan policy (here).
Our China and EM Asia Forecasts
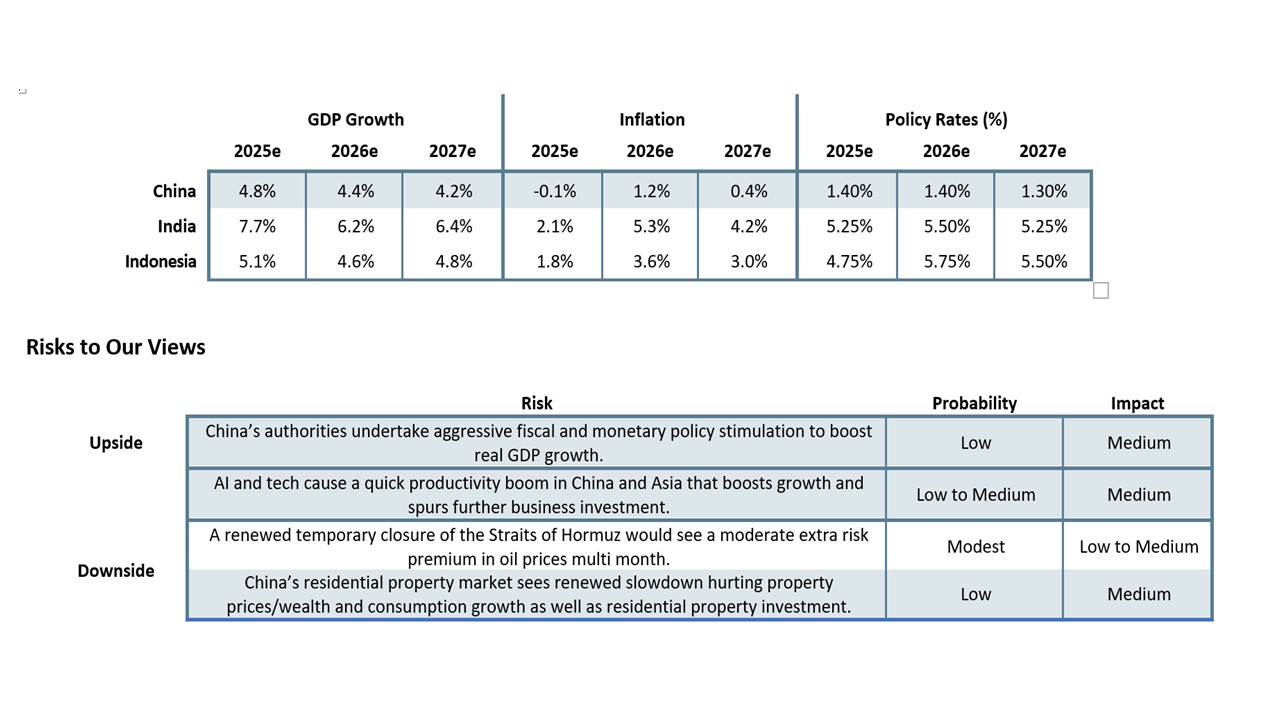
Source: Continuum Economics
China
China has adjusted reasonably well to the spill over of the Iran/U.S. war before the recent U.S./Iran interim agreement and plans to reopen the Straits of Hormuz. Electricity production has quickly switched to coal from LNG, while China proportionality uses less LNG than other Asian countries. The surge in solar/wind and nuclear electricity production since 2022 also provides some resilience, while the surge in electric vehicle usage also reduces oil demand for transport. Finally, China refineries have been running down high commercial stockpiles to partially offset the noticeable slowdown in oil and oil related product imports. However, the breakdown of the monthly numbers does suggest some adverse impact on industrial production/retail sales and PMI, which will trim Q2/Q3 GDP. Higher oil prices are slowly feeding into CPI, due to government controls. We attach an 80% probability to the Iran/U.S. interim agreement sticking and seeing WTI oil prices to USD80 end 2026 and USD70 end 2027 (here), with a 20% probability of Iran threating to temporarily close the Strait of Hormuz.
More broadly, China economic growth continues to shows divergence for GDP drivers, with the new economy doing well but old economy domestic drivers lagging behind. Key points to note include:
· AI/tech and green growth. Active government support as part of the 15th five-year plan is continuing to see new economy areas drive China growth. The authorities’ focus is on self-sufficiency, technology leadership as well as quality of growth. In AI, private company spending is driving semiconductor manufacturing all the way down the AI chain to innovative AI application. Though CAPEX spending is not matching U.S. hyperscalers, China has been narrowing the gap with the U.S. in model performance (Figure 1). This is due to a combination of innovation (China has around 70% of global AI patents); state subsidies for electricity; government support for the sector. Most importantly, China’s tech sector has been keen to AI solutions that can be integrated quickly and are cost effective. This has seen growing adoptions across industries, which is already broadening to marginally help production and productivity. However, the U.S. will likely widen the gap again this year, with the rollout of Nvidia Blackwell chips that are not available in China. The new economy growth story is also about automation as well, as China’s manufacturing sector is also aggressively investing in factory robots to control costs. This has allowed China to continue to compete against countries with lower wages but less automation and productivity. Additionally, China maintains leadership in robotics, which is a growth story into the end of the decade and early 2030s. China’s excellence in manufacturing is helping to keep pace with the U.S. Finally, China’s aggressive support for green energy manufacturing (solar, wind and nuclear) is providing export opportunities through advanced and cost-effective products, with the U.S. having done a U turn in this area under the Trump administration. This story looks solid throughout 2026 and 2027.
Figure 1: Performance of the Top U.S. v China AI Models on the Arena
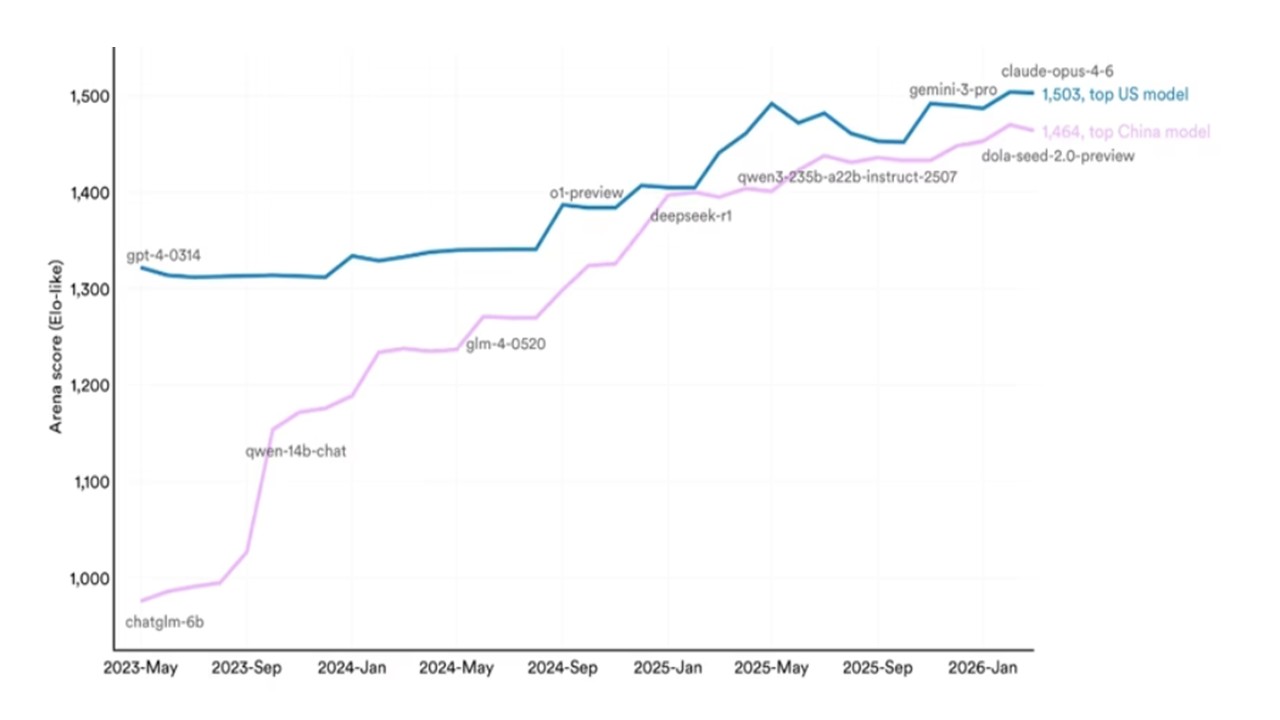
Source: Stanford University AI Index
· Net exports. Monthly trade data suggests that trade momentum remains into 2026, as China diverts exports away from the U.S. to other countries and also through 3rd countries to the U.S. China’s exports are also being helped by leadership in certain sectors e.g., solar and wind, which are growing sectors globally as renewables help produce cost-effective domestic energy against the backdrop of high geopolitical uncertainty for fossil fuels. Thirdly, the trade truce with the U.S. has been extended after the May summit between presidents Trump and Xi. Trump also seems to place less of a priority on getting a comprehensive trade deal and is happy with commitments that China needs to do anyway, e.g., an order for 200 Boeing planes, which is just above the annual pace prior to Trump 1.0. Though China’s effective tariffs to the U.S. are higher than other countries due to the 2018-19 tariffs, China is competitive. The disinflation in China compared to other countries has meant that the real exchange rate has fallen noticeably in recent years (Figure 2). Overall, a positive contribution should be seen in 2026 from net exports, but lower than in 2025. The U.S. will continue to tighten China exports through 3rd countries, while the EU and major EM countries want to avoid any cheap dumping by China manufactures. Export orders also show a softening with the Iran war.
Fig Figure 2: Yuan Nominal Trade Weight Exchange Rate and Real Effective Exchange Rate (Index)
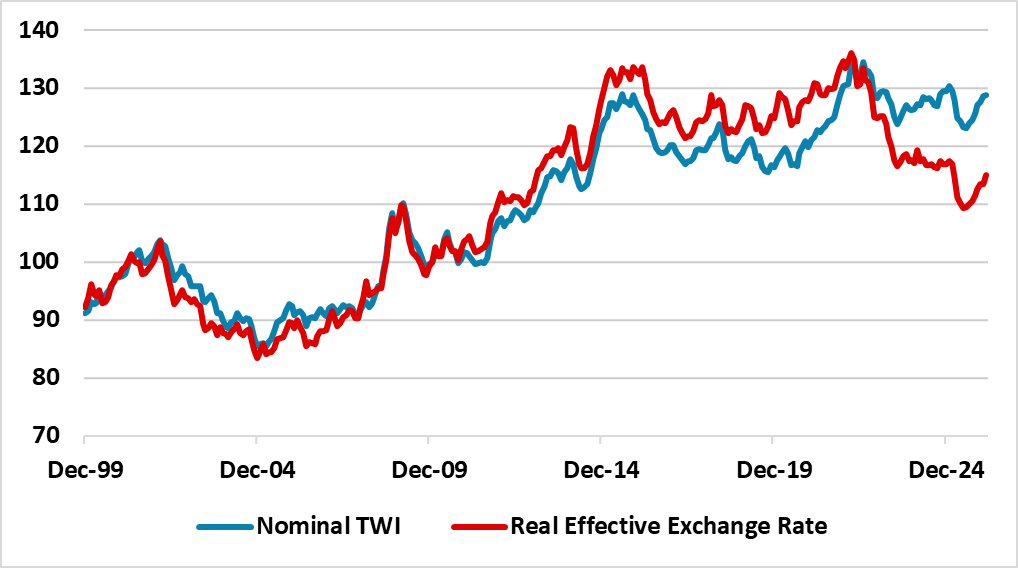
Sou Source: Datastream/Continuum Economics
· Modest underlying consumer spending. China’s consumers are still suffering from the adverse wealth effect from the cumulative large house price decline, given that household wealth remains dominated by housing. Additionally, households are also concerned about current and future income prospects (Figure 3), which we have highlighted in previous Outlooks is a combination of slow nominal wage growth compared to the pre COVID period and slow hiring by private enterprises. The negative YoY household borrowing figure is also a sign that households remain keen to pay down debt and not borrow more. The situation is also impacted by labor market mismatches, with a surge in graduates but not with the tech/manufacturing skills required. Finally, the authorities are not producing a boost to consumption, with 2026 trade in programs less than in 2025 and structural improvement in safety nets (unemployment/health/pensions) remaining small rather substantive. China’s authorities have also not taken up IMF suggestions to improve Hukou benefits for 200mln migrants living in urban areas (here). This all likely means that precautionary savings will remain high and not provide a windfall boost to consumption. It is also worth mentioning that population aging is more evident on a structural basis, which slows new house demand and absolute consumption levels for the over 55’s (here). Modest consumption momentum will likely be the story for 2026 and 2027, though still supported by the traditional broadening of services consumption as a middle-income country matures. Domestic travel is seeing reasonable growth in this context.
Figu Figure 3: Consumer Income Sentiment
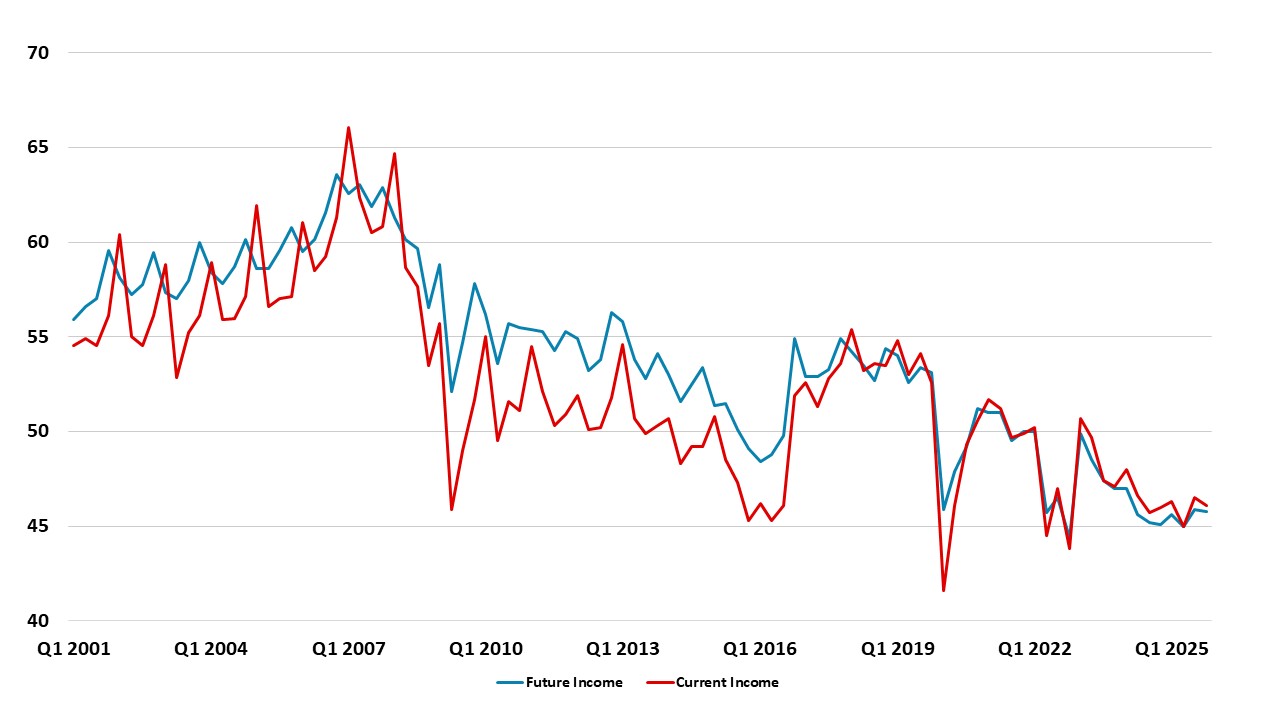
Source: NBS/Datastream
· • Residential property no bottom yet. Official views that the housing market is bottoming appears premature (here). Though the early spring has seen some improvement in house purchases in tier 1 cities like Shanghai and Shenzhen, the wider picture including tier 3 cities remains weak. Firstly, a large inventory of complete and uncomplete property continues to curtail the interest in starting new residential construction. Secondly, property developer’s finances remain volatile, while government support is modest rather than aggressive. Thirdly, households' property optimism has been significantly dented by the bust of the last few years. Demand remains soft and fragile. Though we see the negative drag from residential property on GDP being less in 2026/27 than 2022-24, it will still knock around 0.75% off GDP in 2026 and 2027.
Overall, growth remains unbalanced. Momentum in AI/automation leads economic growth, with support from net exports still. However, consumption is not consistent with a 5% growth pace, as adverse wealth effects and a soft labor market mean only modest consumption. So far, hard data has not shown large scale layoffs from the AI rollout in China, but needs to be watched as this could damage the consumption picture in 2027. While the stimulus announced in March is helpful, it is the same size as 2025. Overall, the underlying momentum for 2026 leaves us forecasting 4.4%. For 2027, we see a further trend slowing to 4.2%, as the structural headwinds to consumption get larger and a soft labor market ingrains cautious among consumer. As always, it could also be that the reported GDP numbers are higher (to hit the 4.5-5.0% target) than the actual reality, as this still remains the political bias for good news messaging.
One consequence of this unbalanced economy and modest consumption growth is that production continues to exceed domestic demand and produce disinflation pressures. Though China’s authorities are keen to avoid price wars, they will not aggressively push for excess production capacity to be shut as this would provide a vicious adverse circle for China’s real GDP. We forecast CPI at 1.2% in 2026 due to more elevated oil and gas prices throughout the year, but 0.4% in 2027 when energy prices come down from current levels.
Fiscal and Monetary Policy
Though China’s authorities have delivered further fiscal stimulus for 2026, this is modest rather than aggressive and similar to 2025. China’s authorities are acting fiscally constrained by the general government debt/GDP trajectory, which the IMF article IV in February forecast could reach 163% of GDP by 2034 (here p40). Extra fiscal measures will be small in 2026, and 2027 will likely see a similar budget deficit (Figure 4). Aggressive fiscal easing will only occur if a hard landing occurs, which is low risk given that the housing market has already bust. Meanwhile, though the Yuan10trn LGFV restructuring is ongoing, this will likely only provide a small boost to growth given LGFV and LG revenue depend on new construction rebounding, which is not our view.
Figure 4: China General Government Deficit/GDP IMF Measure (%)
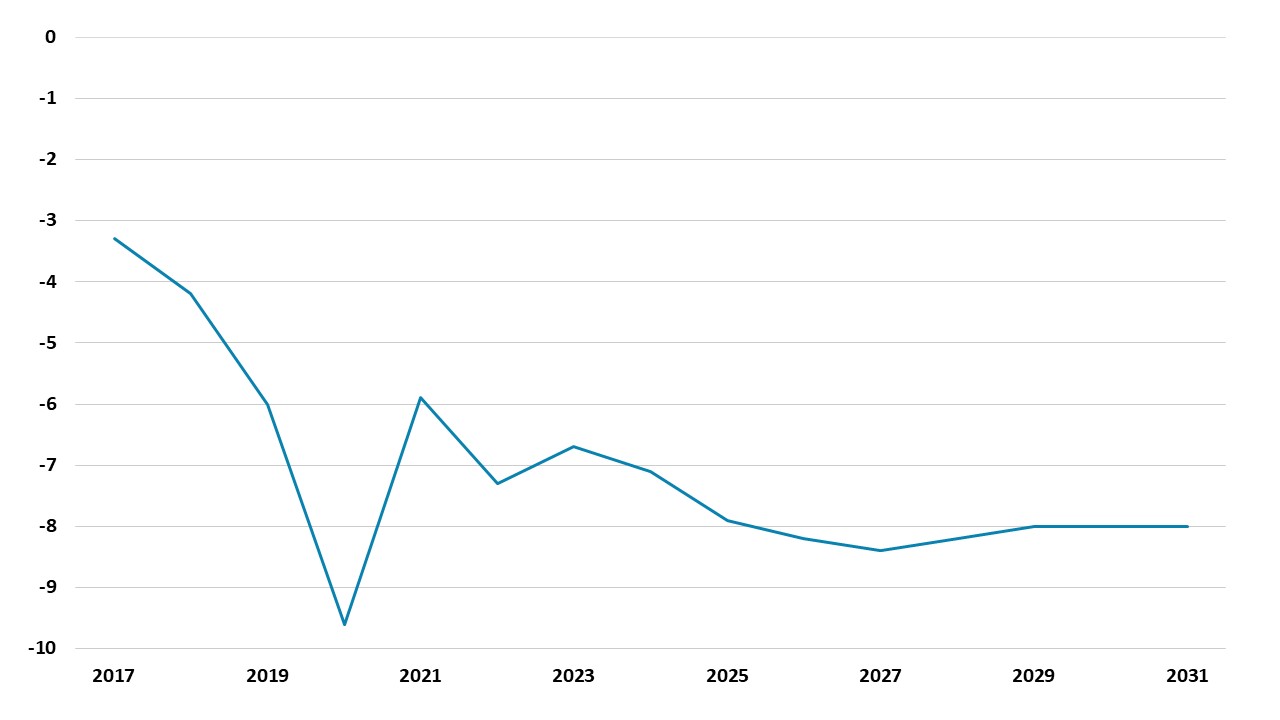
Source: IMF April 2026 Fiscal Monitor
In terms of monetary policy, the authorities’ actions continue to be restrained by concerns that too low interest rates could hurt China’s banking system interest margins and lending. The 2024 PBOC financial stability review (here) shows only 2% of banking assets in troubled banks, but the 2023 stress tests show this could surge with a 100% pick up in NPLs and lower profitability (here). Cutting policy rates risks hurting margins for weak banks and hurting lending capacity!
Combined with the pick-up in inflation in 2026, this now argues against any reduction in the seven-day reverse repo rate in 2026 from 1.4%. Some further scope exists to cut RRR for big banks but they have better balance sheets than small and rural banks. We see 50-75bps reduction in the RRR rate in 2026, which will likely also apply to small banks but not rural banks that are already at the 5% floor.
For 2027, we still see a 10bps reduction in the 7-day reverse repo rate to 1.3%, as the economy softens and inflation falls back to ultra-low levels. Even so, current low interest rates are not stimulating the private sector, as some households and businesses are facing a balance sheet recession, which would ideally require fiscal policy stimulus and market clearing polices to improve confidence.
India: Geopolitical Overhand and Below-Trend Growth
India's economic momentum is expected to moderate through FY2026/27 (April-March), with GDP growth forecast at 6.2% yr/yr, falling short of the Reserve Bank of India's more optimistic projection of 6.6% yr/yr, in our view. The divergence reflects a more cautious reading of the demand environment, particularly on the private consumption side, where a confluence of external and domestic shocks is likely to weigh on household spending power through much of the fiscal year. Private consumption, which accounts for the bulk of India's domestic demand, faces meaningful headwinds in FY2026/27. Elevated food and fuel prices, driven in large part by the ongoing Straits of Hormuz crisis and its knock-on effects on global energy markets, are compressing real household incomes. Fuel consumption declined 6.5% yr/yr in May, reflecting the recent hikes in prices of cooking gas, petrol and diesel. Compounding this is the prospect of a below-normal southwest monsoon. Early tracking of the 2026 monsoon onset has been slow, and the looming risk of an El Niño weather event in late 2026/early 2027 adds to concerns over kharif crop output. A deficient monsoon would not only curtail farm incomes directly but also push food prices higher and further dent rural consumption sentiment. These are not tail risks; they are increasingly the base case, and they anchor the below-consensus growth call for FY2026/27. On the investment side, the picture is more mixed. Private capex remains subdued, with corporate balance sheets cautious amid global uncertainty. The government has reiterated its commitment to maintaining public capital expenditure and infrastructure spending continues to be the key policy lever for supporting growth. However, the ability of public capex to fully compensate for soft private demand and consumption drag is limited, particularly if fiscal pressures force a recalibration mid-year.
Figure 5: India Real GDP Growth Forecast (% yr/yr)
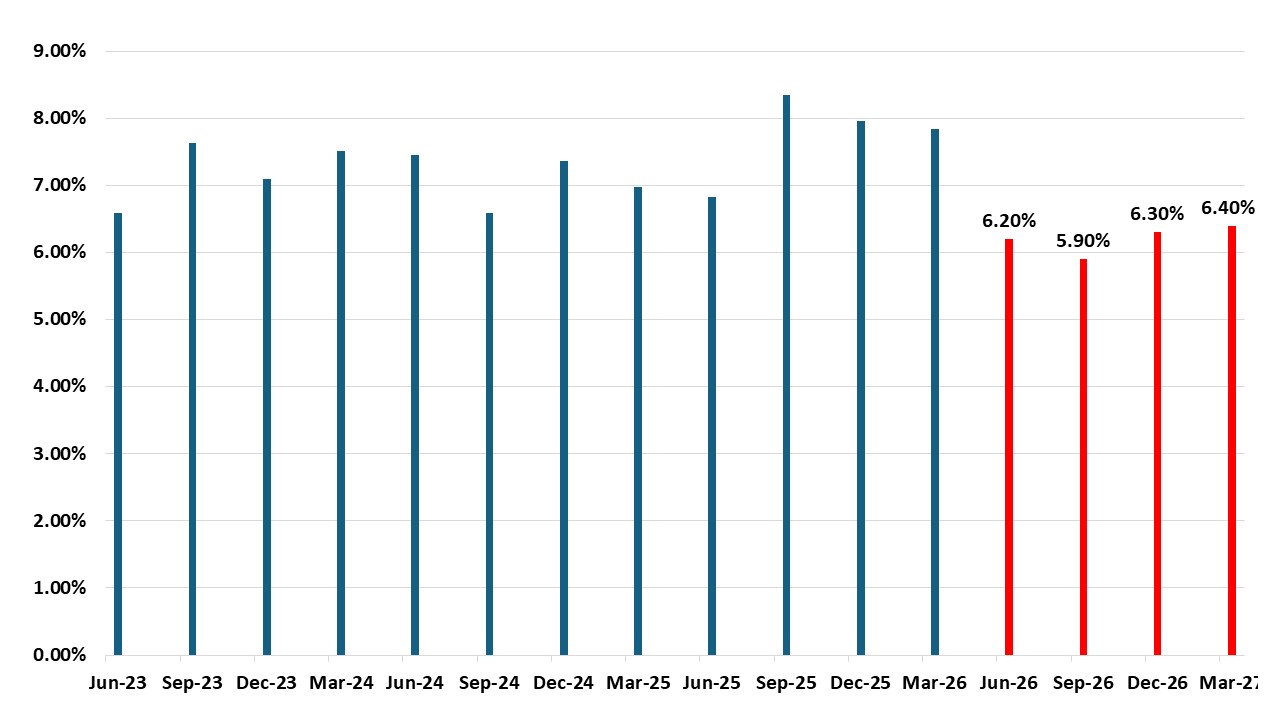
Source: Continuum Economics
On the production side, the three broad sectors present a divergent picture, with agriculture bearing the sharpest near-term risk and services remaining the economy's most reliable engine. Agriculture's performance in FY2026/27 will hinge almost entirely on the monsoon (as noted above). Industry in FY2026/27 presents a mixed but broadly resilient picture. Construction is the standout bright spot, underpinned by continued government infrastructure push (roads, railways and urban infrastructure) and this is likely to sustain reasonable momentum even if private investment stays cautious. Manufacturing faces a more uncertain path: domestic demand softness will cap volume growth in consumer-facing industries, while input cost pressures from elevated fuel and commodity prices squeeze margins. That said, the production-linked incentive scheme pipeline and gradual global supply chain reorientation toward India continue to provide a medium-term structural tailwind for select manufacturing sub-sectors, particularly electronics and pharmaceuticals. Mining output will remain a modest contributor, with no major swing factor anticipated. Services, as has been the case for much of the post-pandemic period, will be the primary growth driver and the sector most likely to outperform. Financial services and insurance are well-positioned, supported by a healthy credit cycle, capital market activity and continued formalisation of the economy. The IT and business services segment faces some global demand uncertainty, particularly from a volatile U.S. economy and client-side budget caution in key export markets but domestic-facing digital services, e-commerce and fintech will continue to expand at a solid pace.
Figure 6: India Inflation and Main Policy Rate (%)
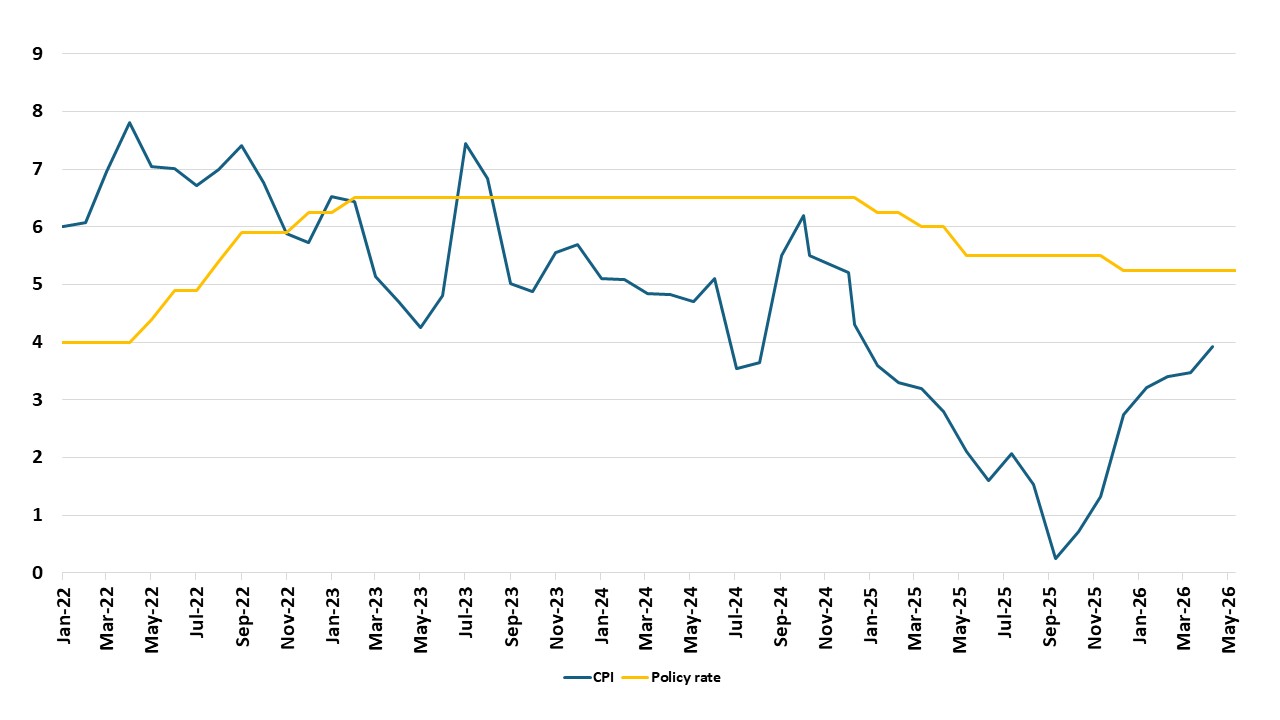
Source: Continuum Economics
Headline inflation is expected to average around 5.3% in FY2026/27, modestly above the RBI's own forecast of 5.1% and sitting uncomfortably close to the upper band of the central bank's 2-6% tolerance range. Food inflation remains the dominant driver, with vegetable and cereal prices likely to stay elevated given monsoon uncertainty and supply disruptions. Fuel inflation, amplified by Straits of Hormuz tensions, adds a second layer of price pressure that feeds through into core categories via transport and input costs.
The RBI has signalled that it remains focused on inflation first, maintaining a neutral policy stance at a current rate of 5.25%. With inflation risks tilted to the upside, a 25 basis point rate hike is expected in 2026, bringing the policy rate to 5.5% — a level at which it is likely to be held through FY2027/28. This trajectory reflects a central bank that sees limited room to ease and increasing reason to tighten modestly, particularly if food and fuel pressures prove more persistent than its baseline assumes. Even so, the central bank’s dovishness will probably restrict the RBI from hiking more, while FX intervention is used to smooth the India Rupee (INR).
The fiscal outlook presents perhaps the most nuanced challenge. The government's stated intention to hold the line on capital expenditure is credible in its ambition but faces significant execution risk. Higher subsidy outgoings, particularly on fuel and fertiliser, both of which are sensitive to global commodity prices and the INR are already testing the budget envelope. If oil prices remain elevated or the currency comes under pressure, the subsidy bill could overshoot materially. The Uttar Pradesh state elections in November 2026 introduce a distinct political economy dimension to the fiscal outlook. Historically, pre-election periods are associated with higher welfare spending, targeted transfers, and a reluctance to trim visible schemes. The risk is that the centre either directly raises expenditure in support of the electoral cycle or finds itself absorbing higher transfer demands from the state.
India's growth trajectory is expected to improve meaningfully in FY2027/28, with real GDP forecast at 6.4% yr/yr as the cyclical headwinds that weigh in FY2026/27 begin to dissipate. A normalisation of monsoon conditions and export recovery (with global trade conditions expected to stabilise) will drive growth. Lower government spending on fuel and fertiliser subsidies should also reduce the populist spending pressures that complicate FY2026/27's budget execution, creating more room for quality capital expenditure. On inflation, the easing of food and fuel price pressures as supply-side shocks fade should bring headline inflation down to around 4.2%. This improvement in the inflation outlook, alongside a more stable currency and receding external risks, is expected to give the RBI room to deliver a 25 basis point rate cut, bringing the repo rate to 5.25% by end of FY2027/28.
India-Pakistan tensions represent a credible tail risk for FY2026/27, with multiple active flashpoints. Pakistan’s attempt to hold assembly elections in Gilgit-Baltistan, territory New Delhi considers illegally occupied has drawn severe criticism from India and the government has reiterated that Pakistan must vacate Indian territories it continues to hold. Separately, India's suspension of the Indus Waters Treaty following the Pahalgam attack last year has added a significant water-sharing dimension to an already strained bilateral relationship, raising the prospect of a conflict. With the Uttar Pradesh elections in November, domestic political incentives to hold a firm line on both fronts are also high. Any military escalation, should it materialise, is expected to be short in duration, a matter of days rather than a prolonged conflict. The fiscal cost of a defence mobilisation, however temporary, would also land at a particularly inconvenient moment for a budget already under pressure from subsidy overruns.
Indonesia: Demand Under Pressure
The Indonesian economy in 2026 will navigate a challenging conjuncture, caught between a weakening rupiah, rising inflation, mounting fiscal pressure and a policy environment that has unnerved businesses and investors. GDP growth is forecast at 4.7% yr/yr in 2026, below Bank Indonesia's own projection range of 4.9–5.7%, reflecting a more cautious reading of both domestic demand conditions and the external headwinds bearing down on the economy. The Iran conflict, El Niño risks and a pronounced shift in monetary policy toward exchange rate defence over growth support collectively define the macro backdrop for the year.
Figure 7: Indonesia Policy Rate and Inflation (%)
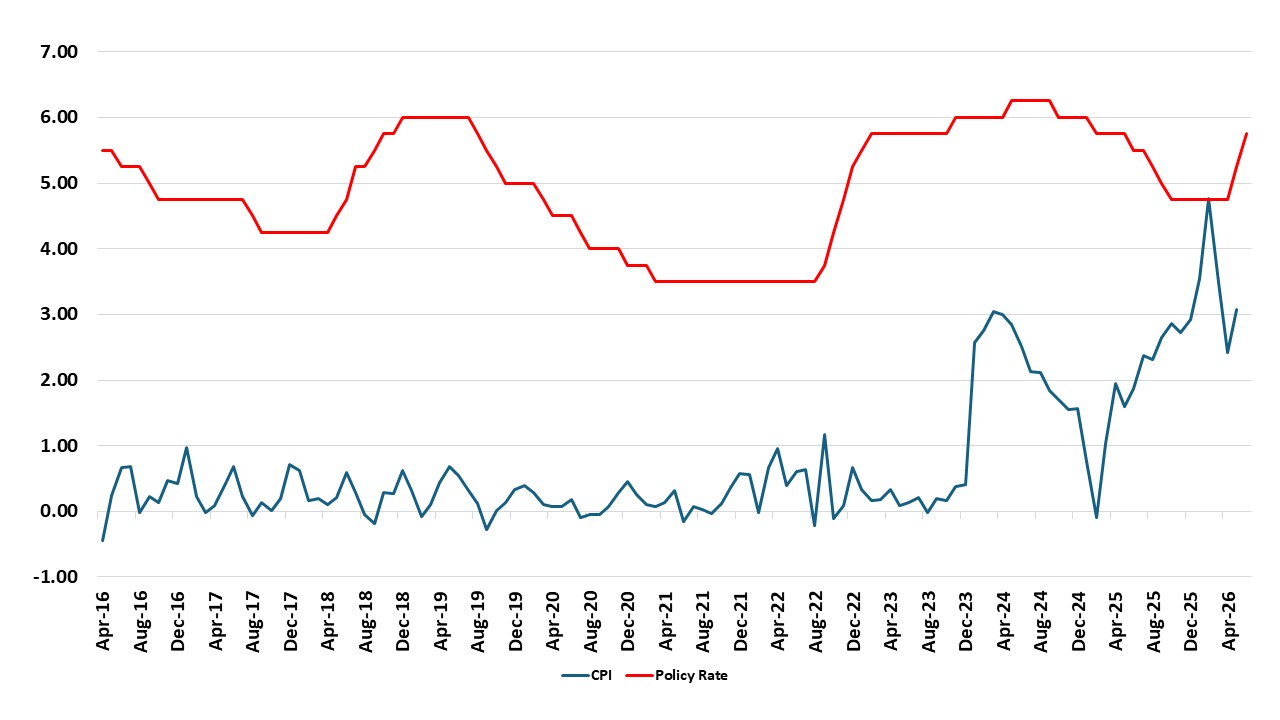
Source: Continuum Economics
Private consumption and government spending remain the twin engines of Indonesian growth, but both are showing strain. Early demand indicators paint a sobering picture: motorbike sales fell 5.1% in May, car sales collapsed 16.8% yr/yr, and retail sales contracted 3.7% yr/yr in April, a sharp deterioration pointing to a household sector under genuine financial pressure. A 32% hike in non-subsidised Pertamax fuel prices in June, the first adjustment since the Iran conflict broke out, is set to compound that squeeze, particularly for middle-income urban households whose transport and commuting costs have risen sharply. We anticipate that the primary impact will fall on purchasing power rather than headline inflation, with households likely to delay discretionary spending on travel, dining and electronics. Export momentum is also fading. The goods trade surplus narrowed from USD 7.6bn in Q4-2025 to USD5.5bn in Q1 2026, and the capital account swung to net outflows of USD 800mn over the same period, compounding pressure on the external account and the currency.
One of the most consequential and market-unsettling policy decisions of 2026 has been the establishment of PT Danantara Sumberdaya Indonesia (DSI), a state-owned entity created to funnel exports of coal, crude palm oil and ferroalloys through a single government-controlled gateway. These three commodities alone generate roughly USD65bn in annual export revenue and account for around 60% of Indonesia's total exports. A transition period runs from June through August 2026, with full operational transfer to DSI targeted for September. This could potentially disrupt buyer networks. The move also caused investor unease around the precedent of tightening state control over the country's most valuable export industries.
Headline inflation is forecast at 3.6% yr/yr in 2026, above the midpoint of Bank Indonesia's 2.5% ±1% target band but within the corridor. The risk profile is firmly to the upside. The fuel price adjustment in June will feed through into logistics, food supply chains and household budgets more persistently than official estimates suggest, despite the government's assertion that the impact will be minimal given the fuel's limited role in public transport. El Niño-driven food price pressures add a second inflation vector that monetary policy cannot easily address. A third and particularly insidious channel is imported inflation, rupiah that briefly touched record lows of IDR/USD 18,000 in early June. Bank Indonesia's response has been striking in its speed and scale. Starting from a rate of 4.75% in May, the central bank has delivered a 100bps rate hike so far, bringing the policy rate to 5.75% in under six weeks. The explicit rationale has been rupiah stabilisation and pre-emptive inflation management, not growth support. Yet despite the aggressive tightening, the bond market recorded net foreign outflows of around IDR 13tn as of mid-June, suggesting that rate hikes have so far failed to meaningfully arrest capital flight. Given continued rupiah fragility, at least one further hike in 2026 cannot be ruled out, though the policy rate is expected to hold at 5.75% through year-end if currency conditions stabilise.
The fiscal position is under significant and growing strain. A budget deficit of equivalent to 0.93% of GDP was recorded in Q1 2026 alone, against a full-year target of 2.68% of GDP, leaving limited headroom for the rest of the year. Politically, fiscal adjustment is complicated by the weight of flagship spending programmes. The Makan Bergizi Gratis free school meals programme, one of President Prabowo's signature campaign commitments — carries a projected 2026 allocation of around IDR 335trn. Political risk is no longer a background concern. Student protests against lavish government spending have grown in scale and visibility, with demonstrators explicitly targeting the perceived contradiction between the Makan Bergizi Gratis programme's ballooning budget and cuts to education and social services. Should protests intensify or broaden into a wider anti-government movement, the risk to investor sentiment, already fragile, could crystallise quickly.
A more benign macro environment should allow Indonesia to regain some lost ground in 2027, with GDP growth nudging up to 4.8%. Commodity export earnings, particularly from palm oil and coal, are poised to firm on recovering global demand. With inflation retreating to around 3.0%, Bank Indonesia will have the latitude to shift gears, cutting rates by 50 basis points to bring the policy rate to 5.25% by end-2027 marking a deliberate pivot from exchange rate defence back toward growth support.