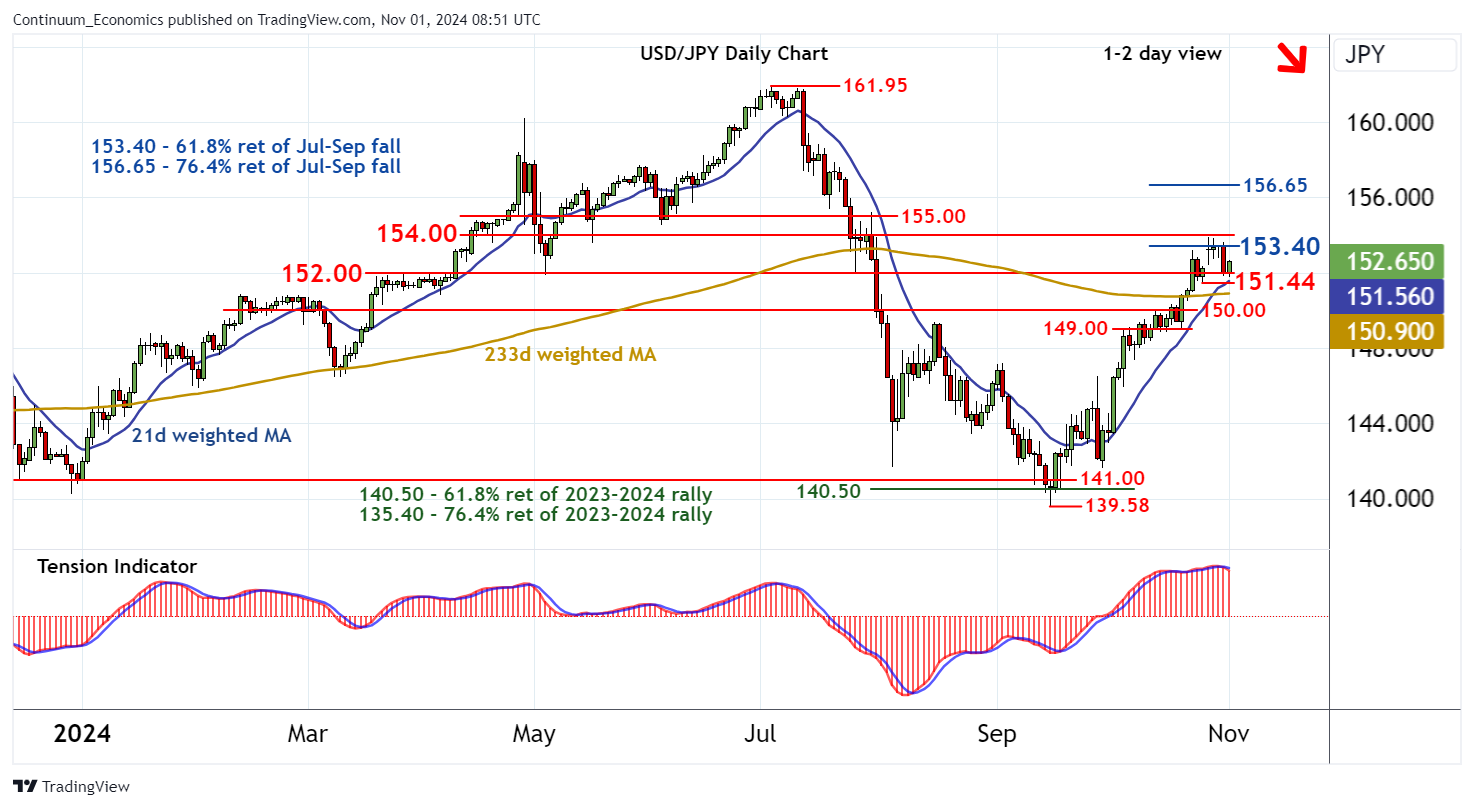
Chart USD/JPY Update: Gains to remain limited

The anticipated test below support at the 152.00 break level has bounced from 151.75/80

| Levels | Imp | Comment | Levels | Imp | Comment | |||
|---|---|---|---|---|---|---|---|---|
| R4 | 156.65 | ** | 76.4% ret of Jul-Sep fall | S1 | 152.00 | ** | break level | |
| R3 | 155.00 | congestion | S2 | 151.44 | 25 Oct low | |||
| R2 | 154.00 | * | break level | S3 | 150.00 | ** | congestion | |
| R1 | 153.40 | ** | 61.8% ret of Jul-Sep fall | S4 | 149.00 | congestion |
Asterisk denotes strength of level
08:40 GMT - The anticipated test below support at the 152.00 break level has bounced from 151.75/80, as oversold intraday studies unwind, with prices currently trading around 152.65. Daily stochastics are under pressure, unwinding negative divergence, and the daily Tension Indicator is also bearish, highlighting a deterioration in sentiment and increased selling interest towards resistance at the 153.40 Fibonacci retracement. Following corrective trade, fresh losses are looked for. However, a close below the 151.44 low of 25 October is needed to turn sentiment negative and open up congestion around 150.00, where rising weekly charts should prompt renewed buying interest.