Published: 2024-11-06T11:42:56.000Z
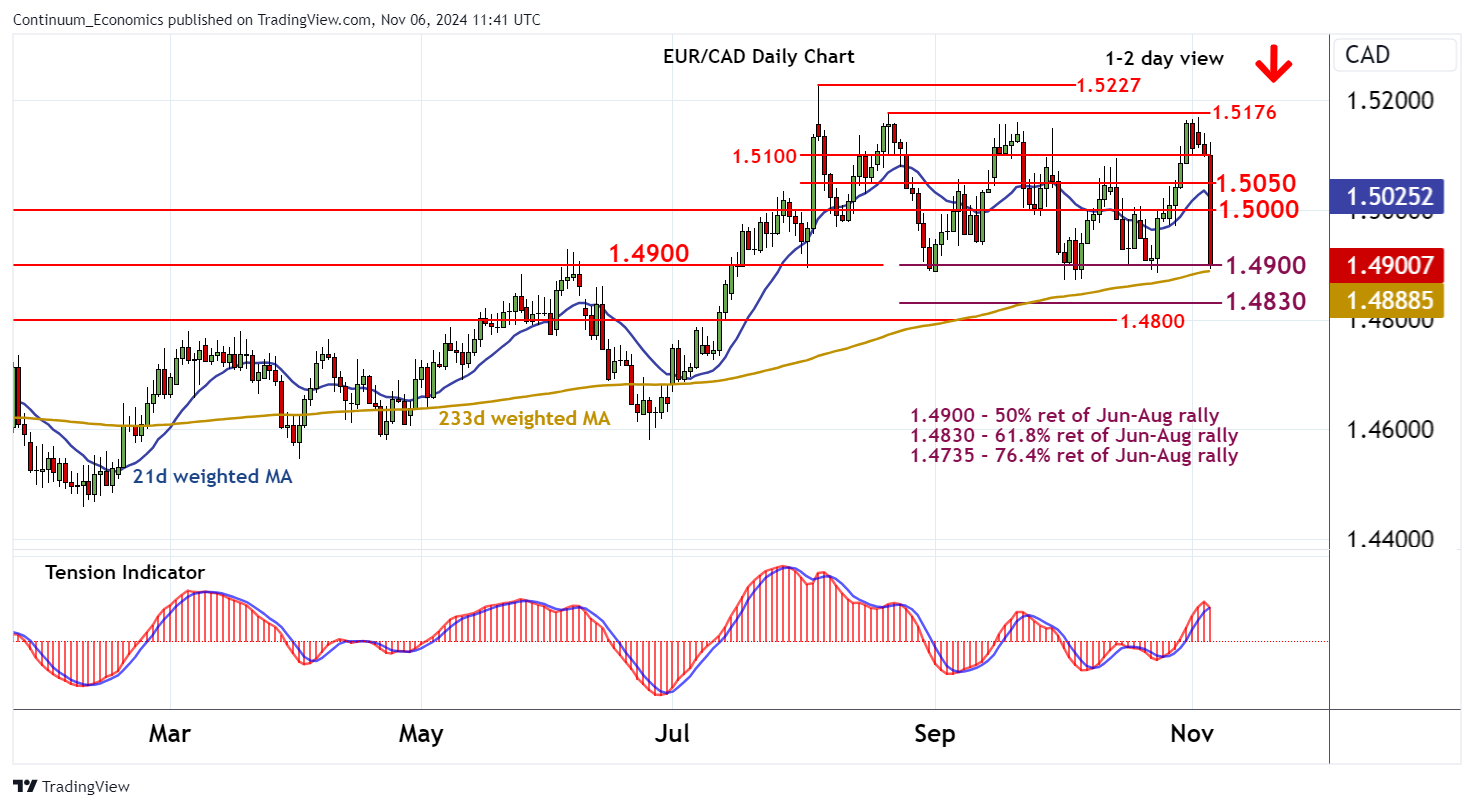
Chart EUR/CAD Update: Sharply lower to the 1.4900 Fibonacci retracement - studies under pressure

Senior Technical Strategist
-

Anticipated losses have broken sharply lower to the 1.4900 Fibonacci retracement

| Level | Comment | Level | Comment | |||||
|---|---|---|---|---|---|---|---|---|
| R4 | 1.5176 | ** | 21 Aug (w) high | S1 | 1.4900 | ** | 50% ret; break level | |
| R3 | 1.5100 | * | break level | S2 | 1.4873 | ** | 2 Oct (m) low | |
| R2 | 1.5050 | break level | S3 | 1.4830 | ** | 50% ret; break level | ||
| R1 | 1.5000 | * | congestion | S4 | 1.4800 | * | congestion |
Asterisk denotes strength
11:15 GMT - Anticipated losses have broken sharply lower to the 1.4900 Fibonacci retracement, where flat oversold intraday studies are prompting short-term reactions. Daily readings have turned down and broader weekly charts are under pressure, highlighting a deterioration in sentiment and room for further losses in the coming sessions. A close beneath here will add weight to sentiment and extend August losses initially towards the 1.4830 retracement. Meanwhile, resistance is lowered to congestion around 1.5000 and is expected to cap any immediate tests higher.