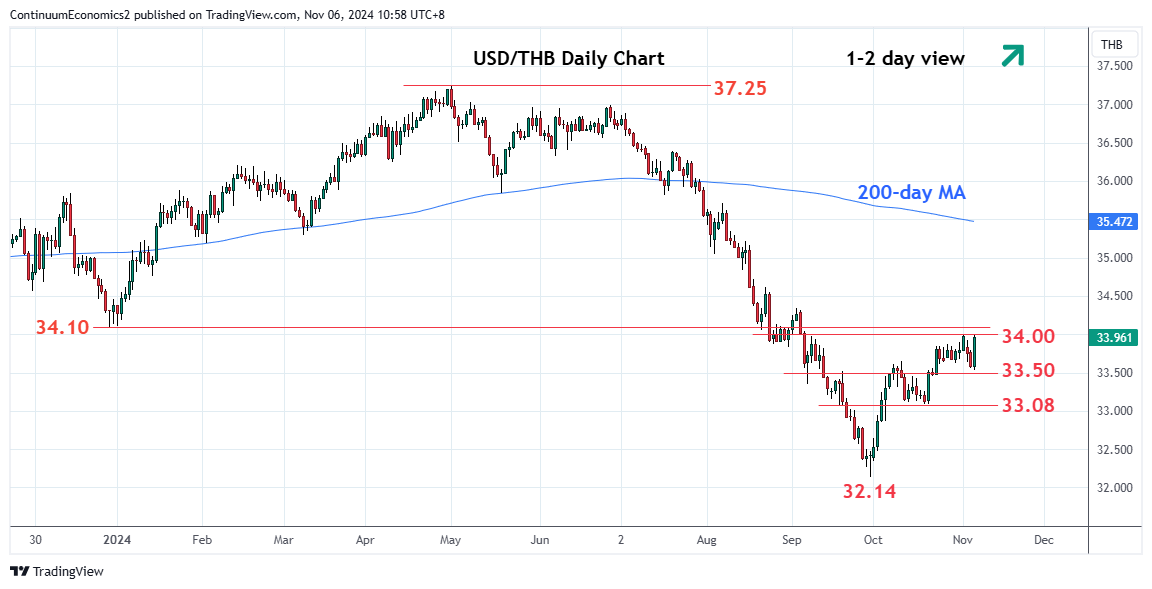
Rebound from the 33.54 low see prices retracing pullback from the 34.00 figure

| Level | Comment | Level | Comment | |||||
|---|---|---|---|---|---|---|---|---|
| R4 | 34.50 | * | congestion | S1 | 33.50 | * | congestion | |
| R3 | 34.33 | * | 3 Sep high | S2 | 33.35 | * | 6 Sep low | |
| R2 | 34.10 | * | Dec low | S3 | 33.08/00 | ** | 18 Oct low, congestion | |
| R1 | 34.00 | * | 38.2% Jun/Sep fall | S4 | 32.80 | * | 25 Sep high |
Asterisk denotes strength of level
03:05 GMT - Rebound from the 33.54 low see prices retracing pullback from the 34.00 figure and 38.2% Fibonacci retracement level. Break here will extend gains from the 32.14 September YTD low to further retrace the steep June/September losses. Higher will see room to the strong resistance at the 34.10, December low. Break here will see room to the 34.33 resistance and the 34.50 congestion. Meanwhile, support at the 33.54/33.50 low and congestion area now underpin and seen sustaining gains from the September low.