Published: 2024-10-24T10:42:06.000Z
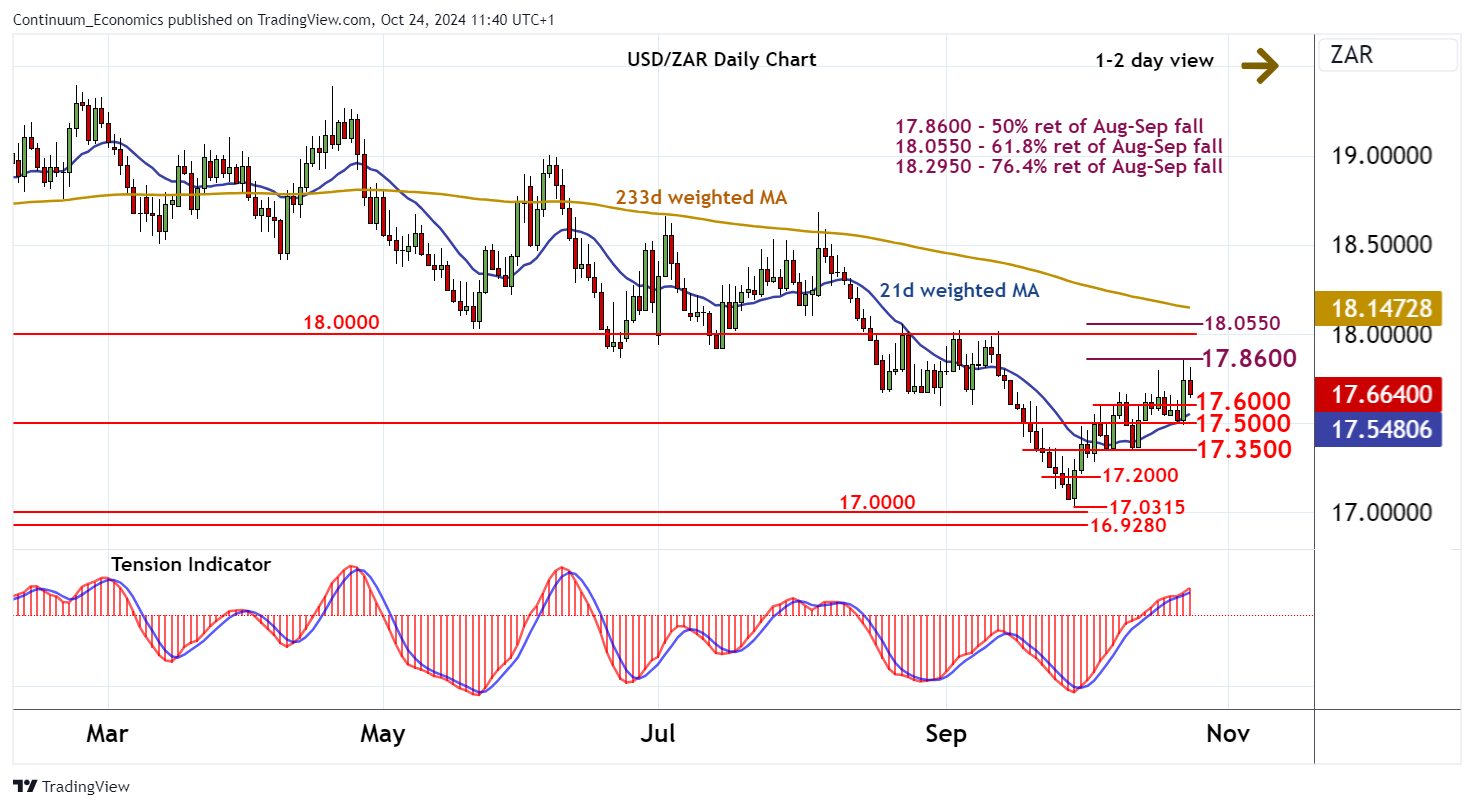
Chart USD/ZAR Update: Consolidating test of the 17.8600 Fibonacci retracement

Senior Technical Strategist
-

Cautious trade has given way to a sharp bounce to resistance at the 17.8600 Fibonacci retracement

| Level | Comment | Level | Comment | |||||
|---|---|---|---|---|---|---|---|---|
| R4 | 18.1000 | break level | S1 | 17.6000 | * | minor congestion | ||
| R3 | 18.0550 | ** | 61.8% ret of Aug-Sep fall | S2 | 17.5000 | * | break level | |
| R2 | 18.0000 | * | congestion | S3 | 17.3500 | intraday break level | ||
| R1 | 17.8600 | ** | 50% ret of Aug-Sep fall | S4 | 17.2000 | intraday pivot |
Asterisk denotes strength of level
11:20 BST - Cautious trade has given way to a sharp bounce to resistance at the 17.8600 Fibonacci retracement, where unwinding overbought intraday studies are prompting a pullback. Focus is on support within the 17.5000 - 17.6000 area, but mixed daily readings are expected to limit any immediate tests in consolidation. A break beneath 17.5000 would open up 17.3500, but rising weekly charts should prompt renewed buying interest towards here. Following cautious trade, higher levels are looked for. However, a close above 17.8600 is needed to turn sentiment positive and extend September gains towards resistance within the 18.0000 - 18.0550 area.