Published: 2024-10-29T00:42:16.000Z
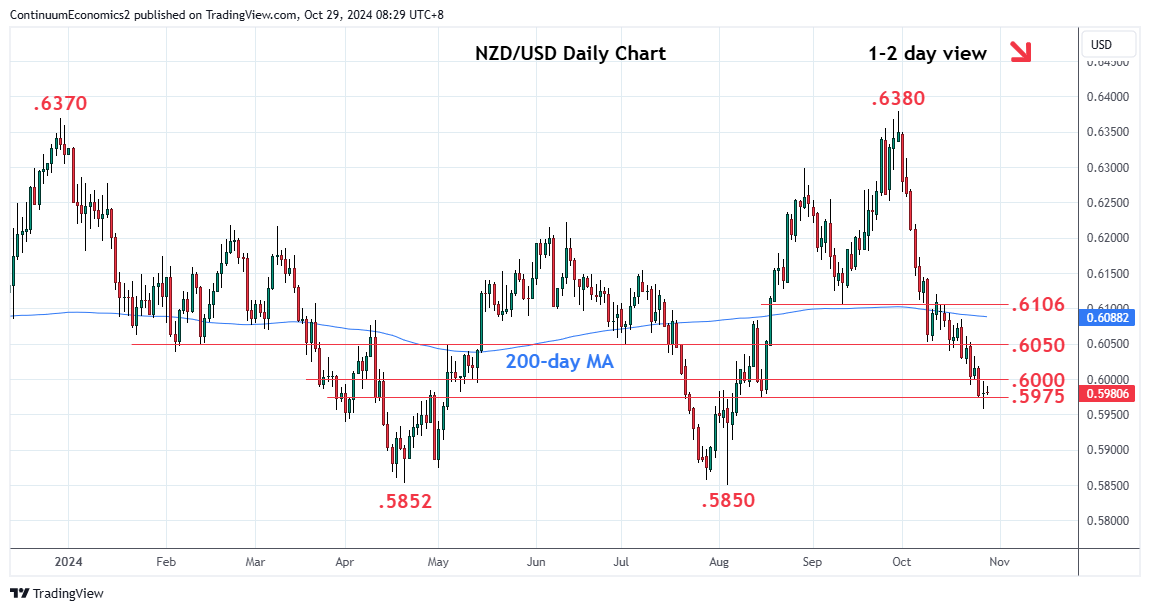
Chart NZD/USD Update: Shallow bounce from .5958 low

Technical Analyst
-
No follow-through on break of the .5975 Fibonacci retracement as prices edged up from the .5958 low to unwind the oversold intraday studies

| Levels | Imp | Comment | Levels | Imp | Comment | |||
|---|---|---|---|---|---|---|---|---|
| R4 | .6106 | ** | Sep low | S1 | .5975 | * | 15 Aug low, 76.4% | |
| R3 | .6085 | * | 21 Oct high | S2 | .5950 | * | congestion | |
| R2 | .6050/52 | ** | congestion, 9 Oct low | S3 | .5913/00 | * | 6 Aug low, congestion | |
| R1 | .6000 | * | figure | S4 | .5852/50 | ** | 19 Apr, 5 Aug YTD lows |
Asterisk denotes strength of level
00:35 GMT - No follow-through on break of the .5975 Fibonacci retracement as prices edged up from the .5958 low to unwind the oversold intraday studies. However, consolidation here expected to give way to renewed selling pressure later and lower will further extend losses from the September YTD high and see room to the .5900 level. Below this will open up the .5852/.5850, April/August lows to retest. Meanwhile, resistance is lowered to the .6000 figure. Regaining this is needed to clear the way for stronger bounce to the strong resistance at the .6050/52 area.