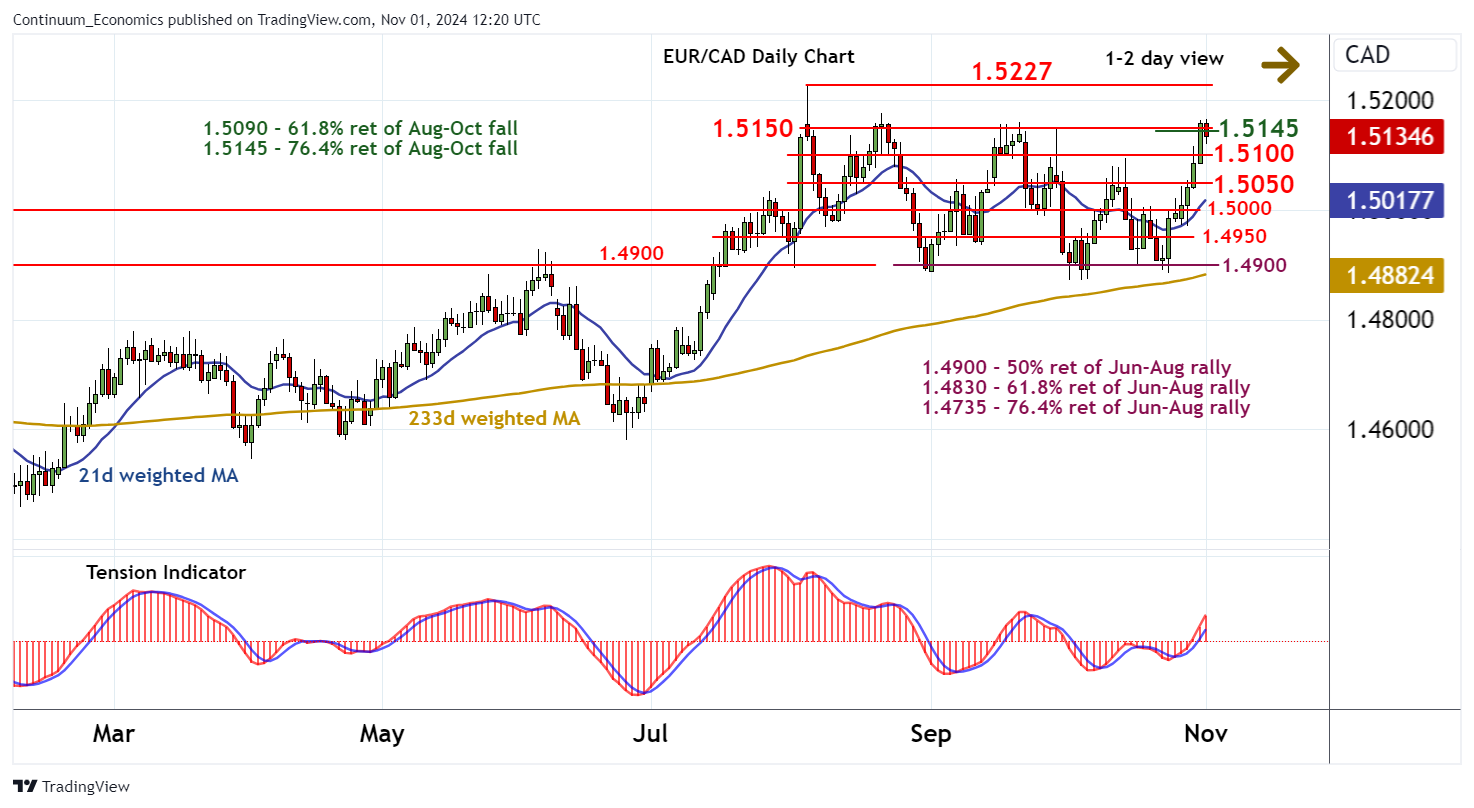
Chart EUR/CAD Update: Consolidating test of 1.5145/50

Anticipated consolidation following the test of strong resistance at the 1.5145 Fibonacci retracement and 1.5150 congestion tops, is giving way to a pullback

| Level | Comment | Level | Comment | |||||
|---|---|---|---|---|---|---|---|---|
| R4 | 1.5375 | ** | 76.4% ret of 2018-2022 fall | S1 | 1.5100 | * | break level | |
| R3 | 1.5227 | ** | 5 Aug YTD high | S2 | 1.5050 | break level | ||
| R2 | 1.5176 | ** | 21 Aug (w) high | S3 | 1.5000 | * | congestion | |
| R1 | 1.5145/50 | ** | 76.4% ret; congestion tops | S4 | 1.4950 | congestion |
Asterisk denotes strength
11:40 GMT - Anticipated consolidation following the test of strong resistance at the 1.5145 Fibonacci retracement and 1.5150 congestion tops, is giving way to a pullback, as intraday studies turn down. Prices are currently trading around 1.5135, but a tick lower in overbought daily stochastics points to potential for further losses towards support at the 1.5100 break level. The rising daily Tensionn Indicator and mixed weekly charts should limit any deeper reactions in consolidation above 1.5050. Meanwhile, a close above 1.5145/50 would improve price action and extend October gains towards critical resistance at the 1.5227 current year high of 5 August.