Published: 2024-11-05T16:55:29.000Z
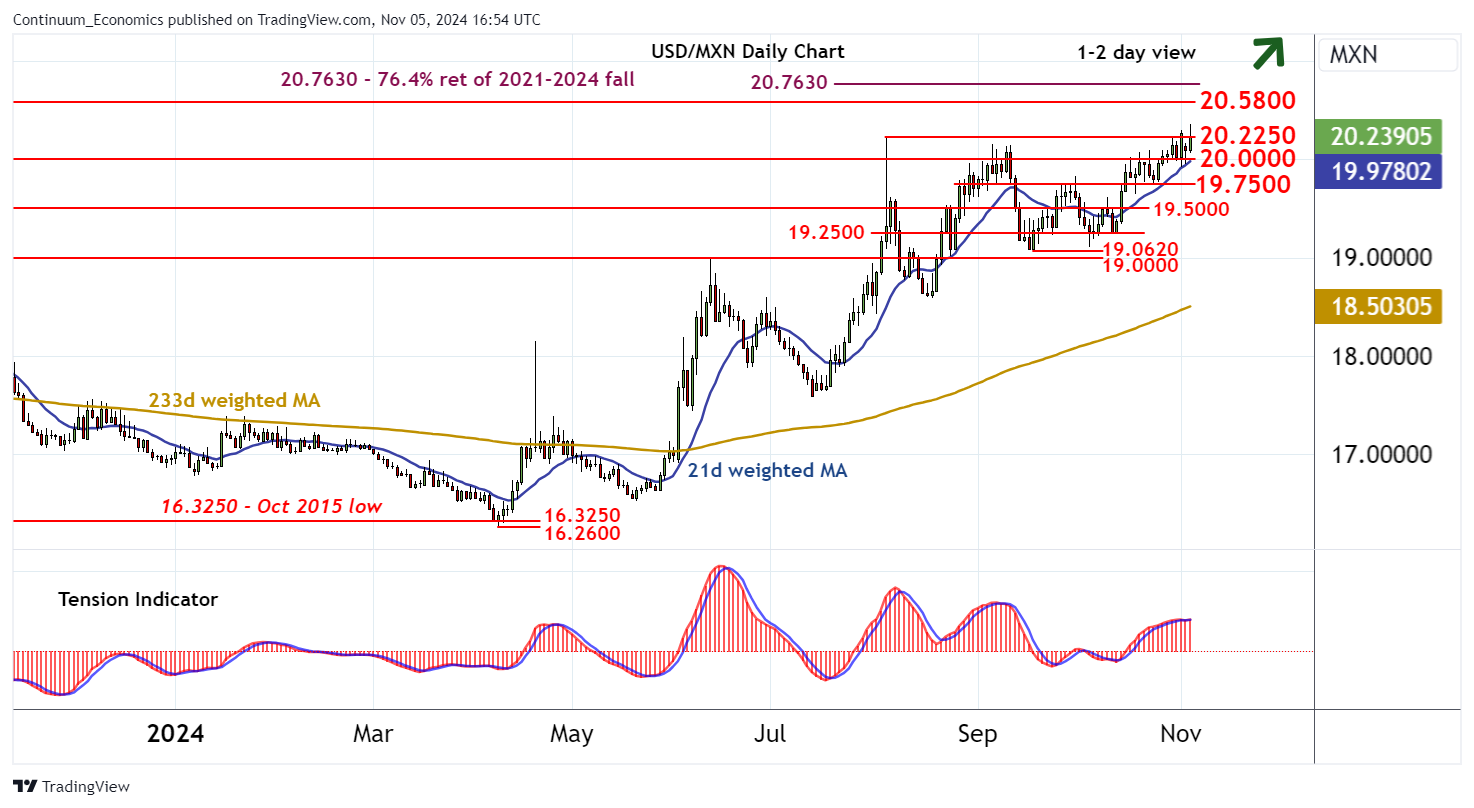
Chart USD/MXN Update: Consolidation following fresh 2024 year high

Senior Technical Strategist
-

Cautious trade is giving way to a test higher

| Levels | Imp | Comment | Levels | Imp | Comment | |||
|---|---|---|---|---|---|---|---|---|
| R4 | 20.7630 | ** | 76.4% ret of 2021-2024 fall | S1 | 20.0000 | * | congestion | |
| R3 | 20.5800 | ** | September 2022 (m) high | S2 | 19.7500 | * | break level | |
| R2 | 20.3530 | current YTD high | S3 | 19.6460 | 18 Oct low | |||
| R1 | 20.2250 | ** | 5 Aug (m) high | S4 | 19.5000 | * | congestion |
Asterisk denotes strength of level
16:40 BST - Cautious trade is giving way to a test higher, with the break above the 20.2250 monthly high of 5 August posting a fresh 2024 year high at 20.3530. Daily readings are mixed, suggesting fresh consolidation around here. But weekly charts are improving, pointing to potential for continuation beyond here towards the 20.5800 monthly high of September 2022. Just higher is the 20.7630 Fibonacci retracement, but mixed longer-term readings are expected to limit any initial tests of this broad area in consolidation. Meanwhile, a close below congestion support at 20.0000 would turn sentiment neutral. But a further close below 19.7500 is needed to signal a deeper pullback and open up a test of congestion around 19.5000.