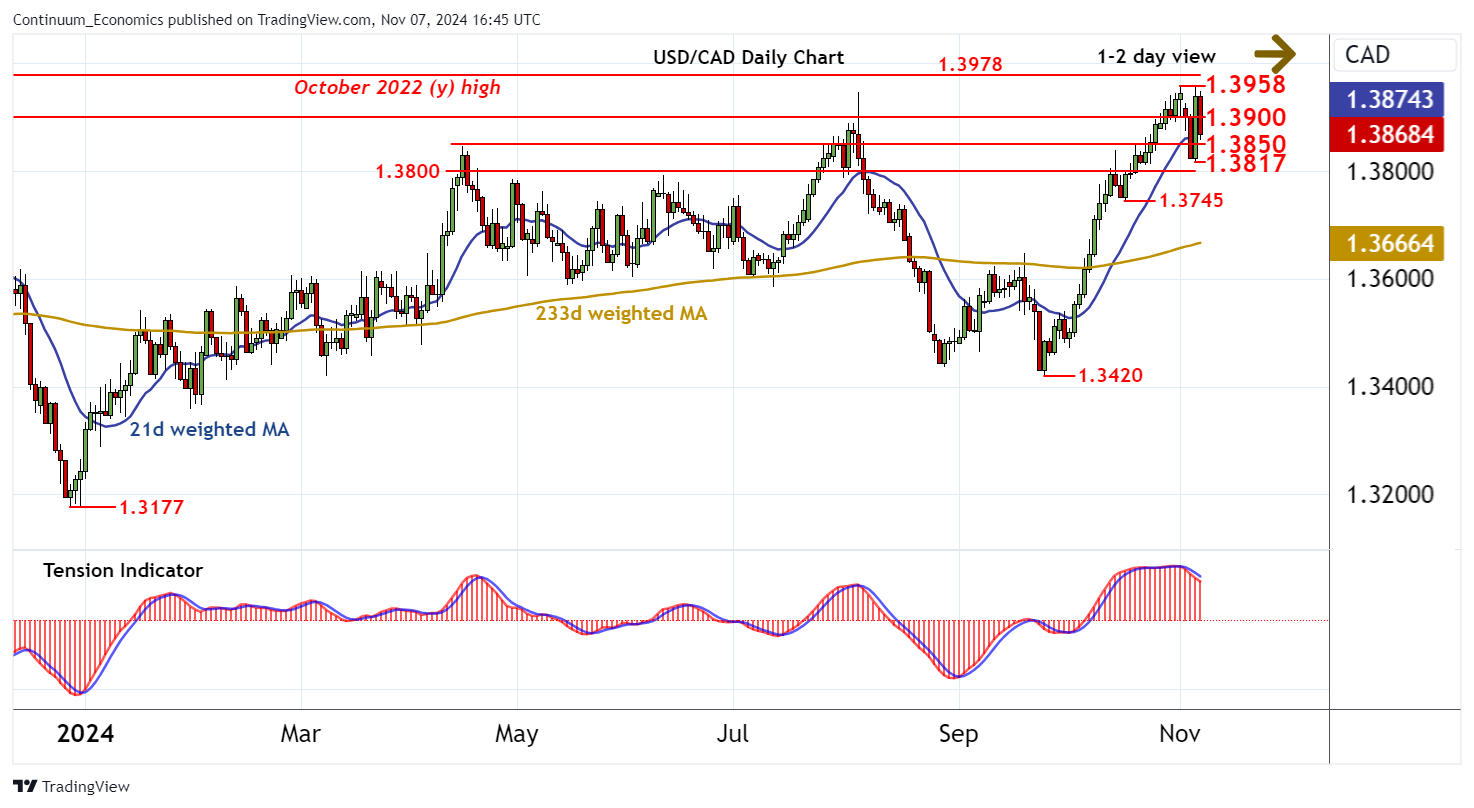
Chart USD/CAD Update: Choppy beneath the 1.3958 current year high

Consolidation following the test of resistance at the 1.3958 current year high of 1 November is giving way to a pullback

| Levels | Imp | Comment | Levels | Imp | Comment | |||
|---|---|---|---|---|---|---|---|---|
| R4 | 1.4040 | ** | 76.4% ret of 2020-2021 fall | S1 | 1.3850 | break level | ||
| R3 | 1.3978 | ** | October 2022 (y) high | S2 | 1.3817 | 6 Nov low | ||
| R2 | 1.3958 | ** | 1 Nov YTD high | S3 | 1.3800 | ** | congestion | |
| R1 | 1.3900 | break level | S4 | 1.3745 | * | 17 Oct (w) low |
Asterisk denotes strength of level
16:30 GMT - Consolidation following the test of resistance at the 1.3958 current year high of 1 November is giving way to a pullback, as intraday studies turn down, with immediate focus on support at the 1.3850 break level. Daily readings are also under pressure and overbought weekly stochastics are flattening, suggesting a deterioration in sentiment and room for further losses in the coming sessions. However, a close below the 1.3817 low of 6 November is needed to turn sentiment outright negative and signal a correction of steady September gains. Meanwhile, a close above 1.3958, if seen, would open up the 1.3978 year high of 1 October. But overbought weekly stochastics should limit any further gains in profit-taking towards critical resistance at the 1.4040 Fibonacci retracement.