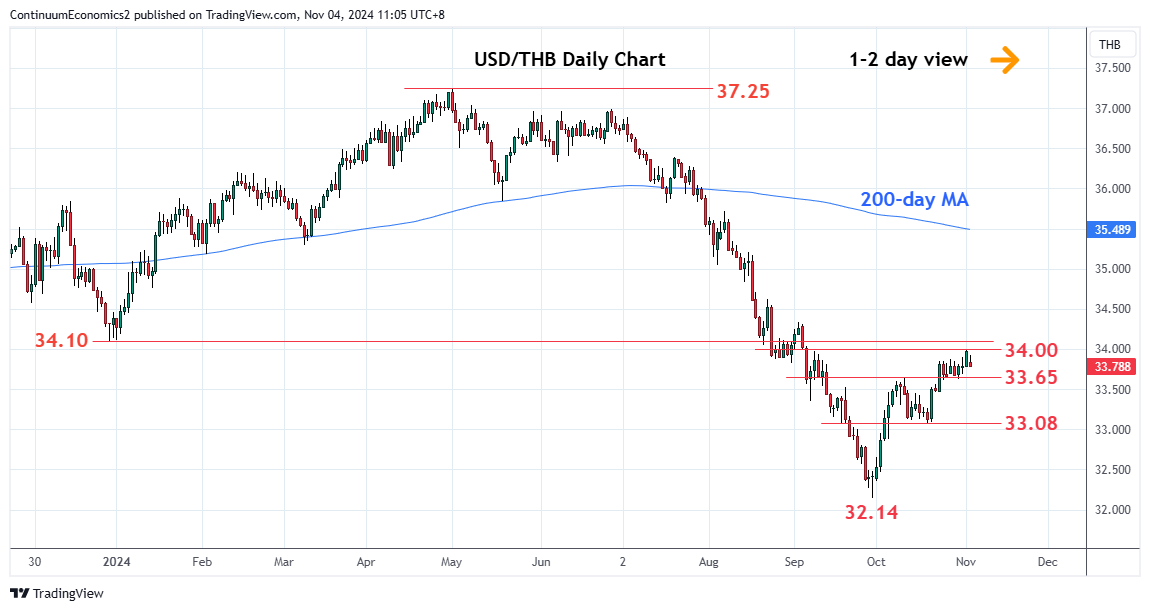
Under pressure from the opening see prices turning down from the 34.00 level and 38.2% Fibonacci retracement level

| Level | Comment | Level | Comment | |||||
|---|---|---|---|---|---|---|---|---|
| R4 | 34.50 | * | congestion | S1 | 33.65 | * | 10 Oct high | |
| R3 | 34.33 | * | 3 Sep high | S2 | 33.50 | * | congestion | |
| R2 | 34.10 | * | Dec low | S3 | 33.08/00 | ** | 18 Oct low, congestion | |
| R1 | 34.00 | * | 38.2% Jun/Sep fall | S4 | 32.80 | * | 25 Sep high |
Asterisk denotes strength of level
03:10 GMT - Under pressure from the opening see prices turning down from the 34.00 level and 38.2% Fibonacci retracement level. Nearby see support starting at 33.65 high of 10 October. Daily studies have turned down from overbought readings and suggest scope for break here to open up deeper pullback to retrace gains from the September low. Lower will see room to the 33.50 congestion. Below this will see room for retest of strong support at the 33.08/33.00 area. Break above the 34.00 level will see room to strong resistance at the 34.10, December low.