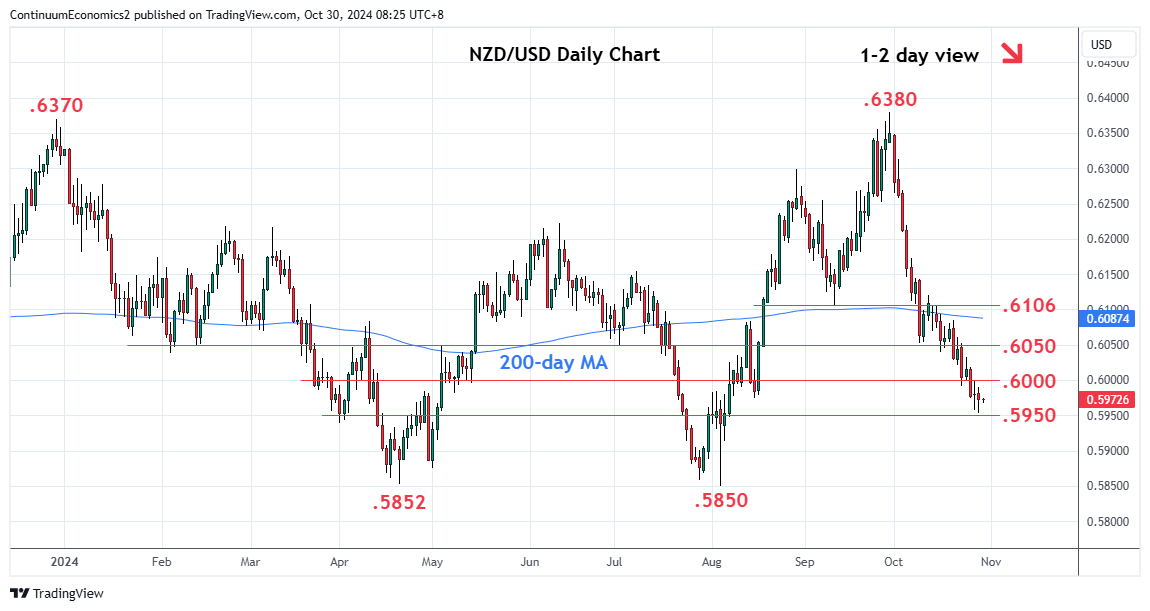
Break of the .5975 Fibonacci level has seen further losses towards the .5950 congestion

| Levels | Imp | Comment | Levels | Imp | Comment | |||
|---|---|---|---|---|---|---|---|---|
| R4 | .6106 | ** | Sep low | S1 | .5950 | * | congestion | |
| R3 | .6085 | * | 21 Oct high | S2 | .5913/00 | * | 6 Aug low, congestion | |
| R2 | .6050/52 | ** | congestion, 9 Oct low | S3 | .5852/50 | ** | 19 Apr, 5 Aug YTD lows | |
| R1 | .6000 | * | figure | S4 | .5775 | ** | 26 Oct 2023 year low |
Asterisk denotes strength of level
00:40 GMT - Break of the .5975 Fibonacci level has seen further losses towards the .5950 congestion. Consolidation above here see intraday studies unwinding oversold reading but focus remains firmly on the downside and highlight risk for break to see extension to the .5900 level. Below this will turn focus to the critical .5852/.5850, April/August lows. Meanwhile, resistance remains at the .6000 figure. Regaining this, if seen, is needed to ease the downside pressure and see room for stronger bounce to unwind the deep oversold daily studies and see room to the .6050/52 area and .6106 resistance.