Published: 2024-11-06T03:35:22.000Z
Chart USD/IDR Updates: Extending gains

Technical Analyst
2
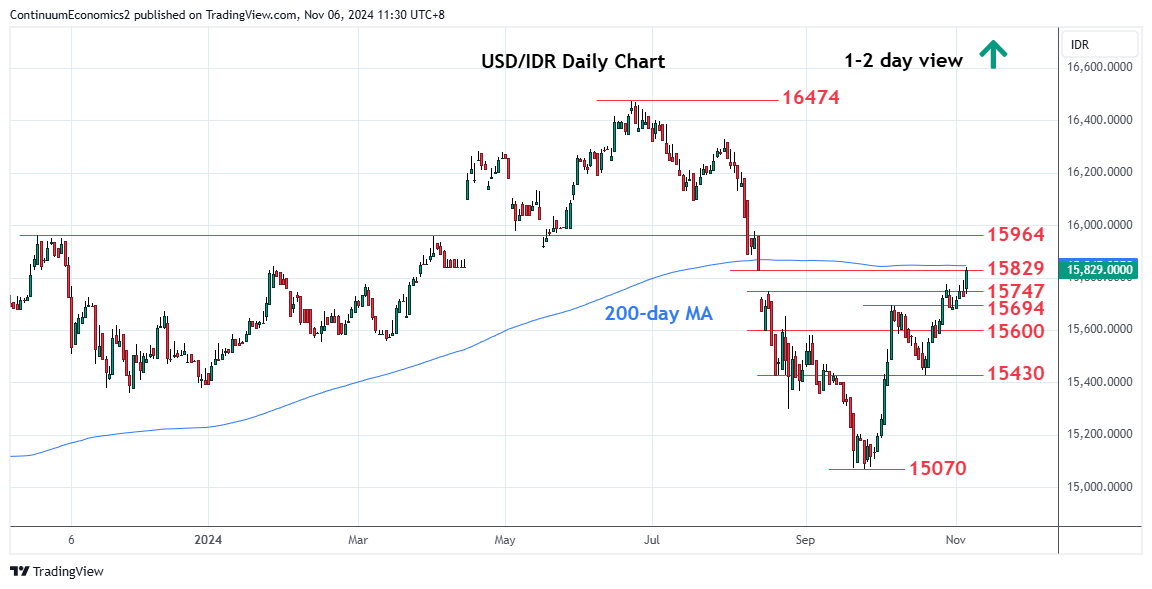
Follow-through above the 15800 level has seen gains to fill the gap at the 15829 low of 13 August

| Levels | Imp | Comment | Levels | Imp | Comment | |||
|---|---|---|---|---|---|---|---|---|
| R4 | 15964 | ** | Oct 2023 year high | S1 | 15747 | * | 16 Aug high | |
| R3 | 15940 | ** | 61.8% Jun/Sep fall | S2 | 15694 | ** | 7 Oct high | |
| R2 | 15900 | * | figure | S3 | 15680 | * | 31 Oct low | |
| R1 | 15845 | * | 200-day MA | S4 | 15600 | * | congestion |
Asterisk denotes strength of level
03:30 GMT - Follow-through above the 15800 level has seen gains to fill the gap at the 15829 low of 13 August. Bullish daily studies suggest room for further gains to retrace the June/September losses and higher will see room to the 15900 figure. Higher still, if seen, will see scope to 15940, 61.8% Fibonacci level, then the 15964, 2023 year high. However, the daily studies remains overbought and caution corrective pullback with support raised to the 15747 and 15694 recent highs which now underpin. Only break of these will fade the upside pressure and see room for pullback.