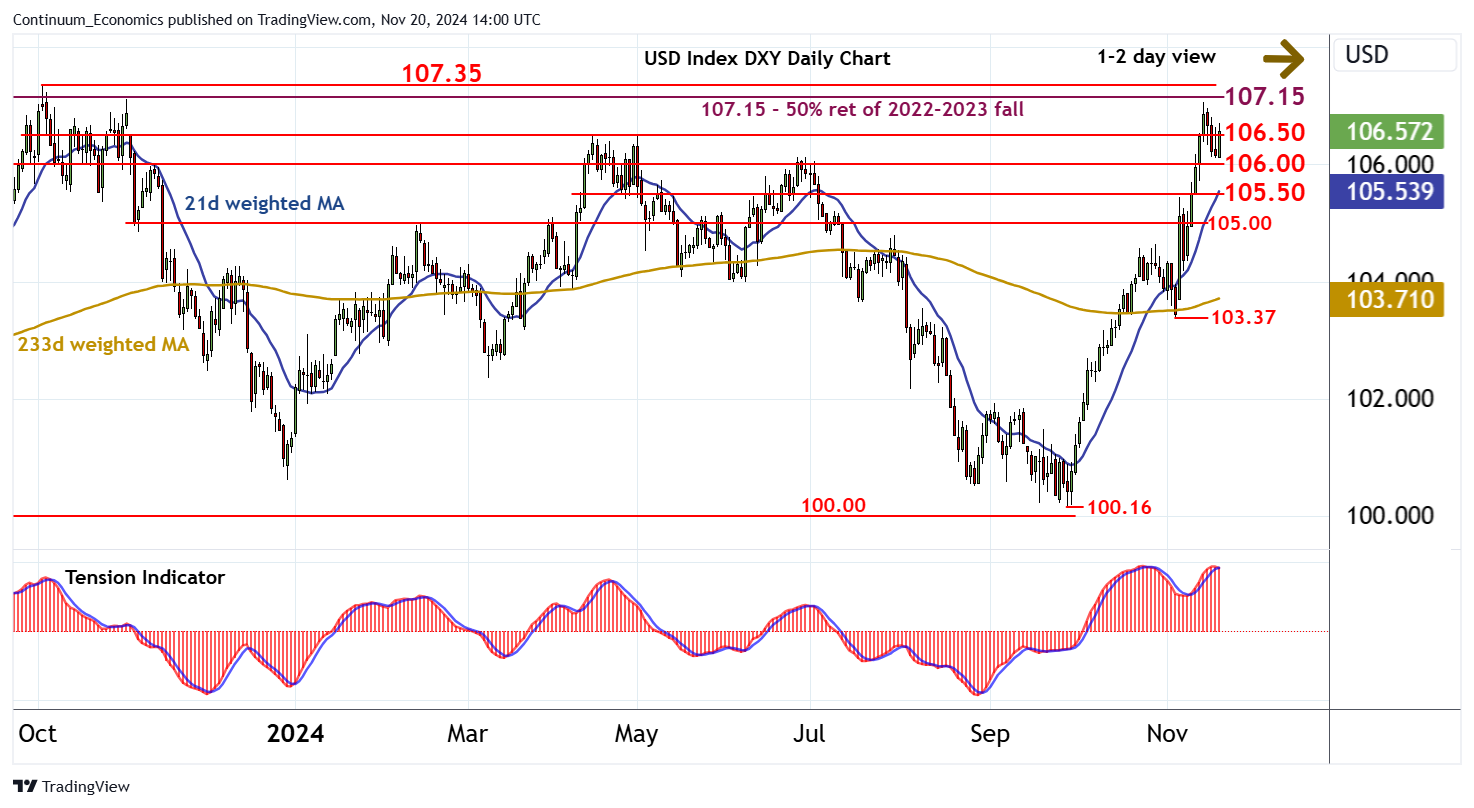
Chart USD Index DXY Update: Gains to remain limited

Little change, as prices extend cautious trade following the bounce from above support at 106.00

| Levels | Imp | Comment | Levels | Imp | Comment | |||
|---|---|---|---|---|---|---|---|---|
| R4 | 107.35 | ** | 3 Oct 2023 (y) high | S1 | 106.00 | * | break level | |
| R3 | 107.15 | ** | 50% ret of 2022-2023 fall | S2 | 105.50 | * | congestion | |
| R2 | 107.06 | * | 14 Nov YTD high | S3 | 105.00 | ** | congestion | |
| R1 | 106.50 | ** | congestion | S4 | 104.21 | * | 29 Oct (m) high |
Asterisk denotes strength of level
13:40 GMT - Little change, as prices extend cautious trade following the bounce from above support at 106.00. Rising intraday studies are prompting a test of congestion resistance at 106.50. But deteriorating daily readings and a tick lower in overbought weekly stochastics are expected to limit any break in fresh selling interest beneath the 107.06 current year high of 14 November. The weekly Tension Indicator continues to rise, but a close above critical resistance at 107.15/35 is needed to turn sentiment outright positive and confirm continuation of July 2023 gains. Meanwhile, support is at 106.00. A close beneath here would add weight to sentiment and open up congestion around 105.50. Further losses would turn sentiment negative and extend November losses towards 105.00.