Published: 2024-10-31T17:37:56.000Z
Chart GBP/USD Update: Under pressure

Senior Technical Strategist
2
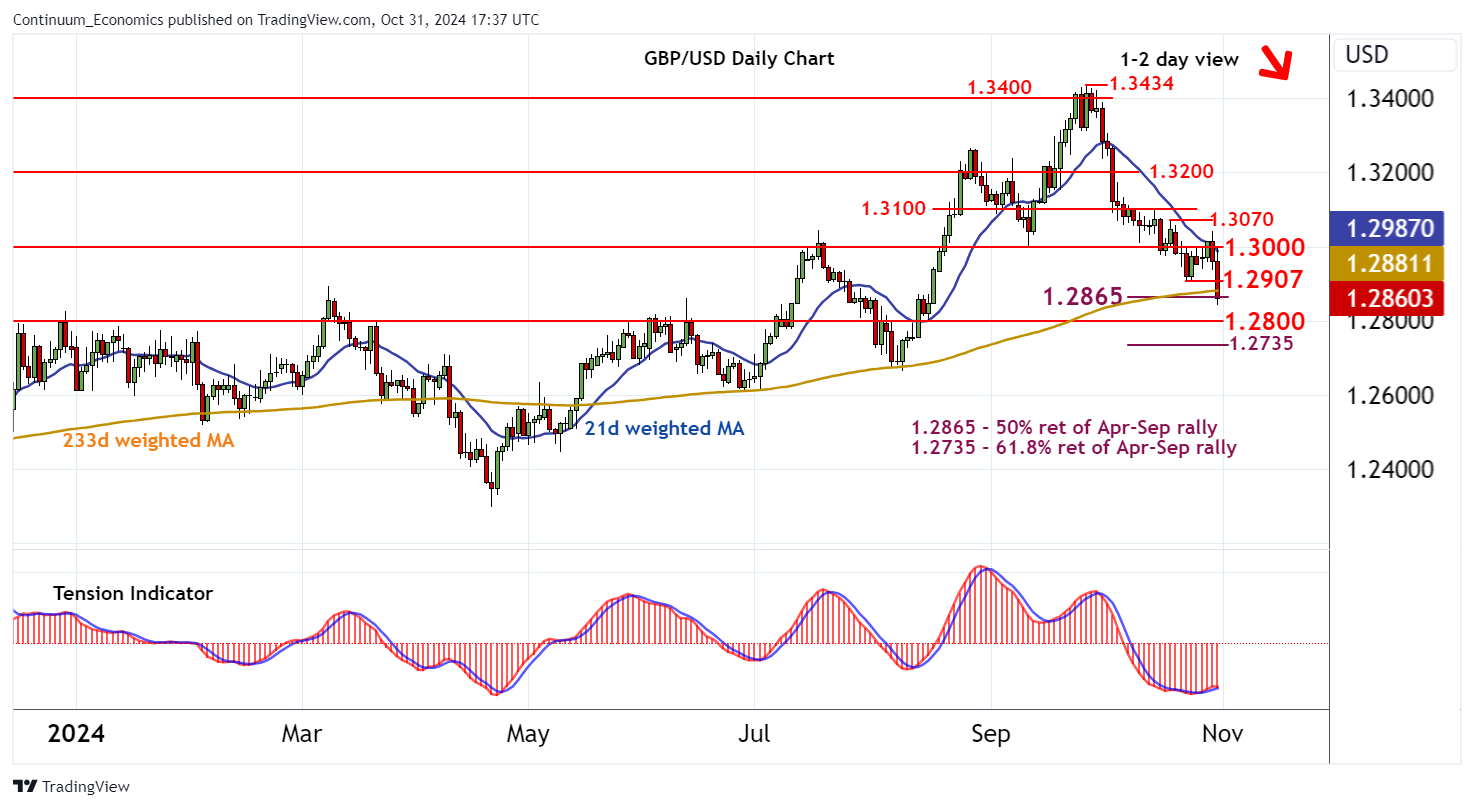
Cautious trade has given way to the anticipated break lower

| Level | Comment | Level | Comment | |||||
|---|---|---|---|---|---|---|---|---|
| R4 | 1.3070 | * | 18 Oct (w) high | S1 | 1.2865 | ** | 50% ret of Apr-Sep rally | |
| R3 | 1.3043 | 30 Oct high | S2 | 1.2800 | ** | congestion | ||
| R2 | 1.3000 | ** | congestion | S3 | 1.2735 | ** | 61.8% ret of Apr-Sep rally | |
| R1 | 1.2907 | * | 23 Oct (w) low | S4 | 1.2700 | * | congestion |
Asterisk denotes strength of level
17:30 GMT - Cautious trade has given way to the anticipated break lower, with prices currently pressuring support at the 1.2865 Fibonacci retracement. Both intraday and daily readings are under pressure, highlighting a bearish tone and room for deeper losses in the coming sessions. A close beneath here will add weight to sentiment and extend late-September losses towards congestion around 1.2800. Still lower is the 1.2735 retracement. Meanwhile, resistance is lowered to the 1.2907 weekly low of 23 October. A close above here, if seen, will turn sentiment neutral once again and give way to consolidation beneath congestion around 1.3000.